Methylation marks tumor suppressors

Sharp and broad H3K4me3 peak definitions

Sharp and broad H3K4me3 peak definitions{credit}Chen et al. Nat. Genet. 2015{/credit}

Modifications to histones, including methylation and acetylation, are used by cells to regulate gene expression. Though a lot is now known about how different histone marks correlate with transcriptional activation or repression, the “histone code” has not yet been fully elucidated. As we discussed last week, a recent study found that, contrary to expectation, genes that are dynamically regulated during development do not display histone modifications normally associated with active transcription.

A new study published this week in Nature Genetics reports another unexpected epigenetic pattern. Tri-methylation of histone 3 at lysine 4 (H3K4me3), a mark associated with active transcription, is usually present as a sharp, narrow peak at the gene promoter. The authors of the study observed that some genes show a different pattern of H3K4me3: broad, low density methylation spanning up to 10kb along the gene body.

The broad H3K4me3 mark was associated with high gene expression levels and transcriptional stability in this study. The authors also found that cell identity genes and, interestingly, tumor suppressor genes, were enriched for the broad H3K4me3 mark.

broadpeaks_genes

H3K4me3 density at housekeeping genes and tumor suppressor genes. Right panel is a zoomed-in version of the left panel.  {credit}Chen et al. Nat. Genet. 2015{/credit}

Though it is unclear why tumor suppressors specifically would be associated with this mark, a comparison between normal and tumor cells showed that H3K4me3 peaks at tumor suppressor genes became narrower in cancer cells and that this was associated with transcriptional repression. Finally, the authors showed that candidate tumor suppressor genes could be identified by the broad H3K4me3 mark.

We asked one of the study’s lead authors, Wei Li, to tell us a little more about the study:

What was the motivation for your studies?

The general motivation was to make novel discoveries based on existing ‘big data’ in epigenomics. In order to do so, we have had to develop novel bioinformatic tools that will enable us to look at the data from a completely different angle.  In particular in this study, we developed a new tool to quantify the H3K4me3 signal based on its width only. Most previous studies have only focused on its height or total signal, because the majority of genes (>95%) only have narrow (<1 kb) and high H3K4me3 peaks.   This simple method has never been used in epigenomic data analysis before. We further proved that this computer-derived broad H3K4me3 signal alone is sufficient to define both known and novel tumor suppressors and its performance is even better than the human curated KEGG pathway in cancer (a collection of well-curated signaling networks involved in cancer development).

When you first observed broad H3K4me3 peaks, did you expect that it would be such a widespread feature of tumor suppressor genes?

No, it is totally unexpected. Many people in the field (including ourselves) observed broad H3K4me3 peaks long time ago (even in the first histone mark ChIP-seq paper published in 2007), but all ignored them and treated them as potential sequencing artifacts.  My lab used the UCSC genome browser to check epigenetic patterns gene by gene on a daily basis, and we gradually noticed that broad H3K4me3 peaks are consistently observed in different datasets and specific to a small group of genes. To test whether it is an artifact or not, we decided to perform a functional enrichment analysis of genes marked with broad H3K4me3. If nothing is enriched, it must be a sequencing artifact.  Interestingly, we found an unexpectedly strong enrichment in tumor suppressor genes.

Did you consider whether any other classes of genes were enriched in this histone mark?

We used an unbiased data-driven approach (rather than hypothesis driven) to study the genes marked with broad H3K4me3 peaks. It turns out that only cell identity genes and tumor suppressors are enriched. When we removed cell-type specific broad H3K4me3 peaks by epigenomic conservation analysis, tumor suppressors is the only class of genes that are enriched in the conserved broad H3K4me3.

Widespread shortening of H3K4me3 peaks in cancer

Widespread shortening of H3K4me3 peaks in cancer{credit}Chen et al. Nat. Genet. 2015{/credit}

Tumor suppressors are defined by their role in cancer. Why do you think they show a similar pattern of H3K4me3 in normal cells?

A common feature of tumor suppressors is that they are usually highly expressed in normal cells to prevent tumor formation. This is likely why they show a similar pattern of H3K4me3 because broad H3K4me3 is associated with increased transcription elongation and enhancer activity together leading to exceptionally high gene expression in normal cells.

Not all tumor suppressors show the broad H3K4me3 mark. Why do you think this is?

Cancer is always heterogeneous. To my knowledge, there is no single mechanism in the literature that can specifically explain all tumor suppressors. Broad H3K4med3 is not an exception.

 

Developmentally regulated genes break the rules

A new study published online this week in Nature Genetics reports that a certain class of genes, those with expression restricted to a specific developmental time point, follow a different set of rules than the rest of the genome.

The modifications to histones in promoter and enhancer regions are generally predictive of gene expression. For example, when a promoter is highly methylated at lysine 4 on histone H3 (H3K4me3), its associated gene is generally highly transcribed. Other marks may also be associated with activation, while different marks are associated with gene repression.

Developmentally regulated genes show similar H3K4me3 levels to silent genes, even though they are highly expressed during development.

Developmentally regulated genes show similar H3K4me3 levels to silent genes, even though they are highly expressed during development.{credit}Pérez-Lluch et al. Nat. Genet. doi: 10.1038/ng.3381{/credit}

SÍlvia Pérez-Lluch et al. examined the expression levels and histone modifications for all genes in the Drosophila modENCODE data set and identified a surprising pattern. Genes that were restricted in their expression to a specific developmental timepoint (called “developmentally regulated genes”) lacked epigenetic marks of active transcription, even when they were highly expressed. The authors confirmed the same pattern using modENCODE data for the netmatode C. elegans. 

Developmentally regulated genes  showed  expression levels during their actively transcribed period that were similar to those of  genes that are expressed stably throughout development. Another pattern identified by the authors was that strong histone marking is also associated with transcriptional stability. Comparable expression and chromatin modification data to that of the fly and worm aren’t yet available for mammals across multiple developmental timepoints. However, using data from ENCODE, the authors were able to show that mammalian cells showed a similar trend with regards to transcriptional stability.

We asked the lead authors of the study,  SÍlvia Pérez-Lluch, Montserrat Corominas and Roderic Guigo to give us a little insight into the history of this study and where they see this research going in the future:

When you began this study, what were your expectations? Did you expect to find that active chromatin marks were missing from so many actively transcribed genes?

We did not. Actually, our initial aim was not to investigate the relationship between chromatin marking and transcription, but the role of histone modifications in the regulation of splicing. We designed our initial experiments to compare levels of histone modifications in exons that were differentially included between Eye-antenna and Wing imaginal discs (EID and WID)—our hypothesis at that time being that the levels of some histone modifications would correlate with differential exon inclusion between these two tissues. But the results were quite frustrating, since we did find, in general, very low levels of marking in exons that were differentially included between WID and EID. This was initially very disappointing to us.  However, we also found, more generally, that many genes that were differentially expressed between WID and EID had also very low levels of a number of histone modifications typically associated to active transcription—even genes with very high expression levels. Since many such genes are likely to be regulated during development, this led us to hypothesize that lack of active histone modifications could be a general feature of developmentally regulated genes. This seemed an implausible hypothesis, going against the current models of the relationship between chromatin marking and transcription. Nevertheless, we turned to modENCODE data to further test it. The results were so strikingly consistent with our model that we “forgot” about our initial aim, and we focused our efforts instead into gathering additional supporting evidence. Understandably, our results were initially met with skepticism—the concern being that lack of chromatin marking could be a technical artifact derived from developmentally regulated genes having restricted expression patterns, and therefore making histone modifications difficult to detect using current technologies. Thus, a substantial amount of our work has been directed to address this concern.

Why do you think this pattern had not been observed before?

We are actually not the first to observe transcription with apparent lack of histone modifications. There have been a few reports of genes being transcribed in the absence of some histone modifications. Our main contribution is to show that this phenomenon is more widespread that generally assumed, and that it characterizes specifically genes that are regulated during development (at least in fly and worm). Why has this not been observed before? Mostly because data containing estimates of gene expression and histone modification along a sufficiently large number of developmental time points were not available before the modENCODE project. Then, we used a very simple, but effective measure to identify genes regulated during development, the coefficient of variation of gene expression. In summary, to make this observation you need both the data and the right approach to look at it

Your study showed that the link with transcriptional stability is also present in mammalian cells. If the association between chromatin marks and developmental regulation also holds in mammals, what, if any, do you think are the implications for biomedical research?

This is difficult to answer. Our initial results suggest that the model could be also applicable to mammals, but the data to test it are not yet available. Here we need to emphasize the importance of well-designed large-scale data production projects that monitor genome activity (transcription, chromatin structure, 3-dimensional genome organization, transcription factor binding, etc.) in a systematic and consistent way. We also want to emphasize that, at this point, our research is very basic. However, one could speculate that if our model holds in mammals, it could contribute to design better-informed approaches to manipulate/modulate expression levels of genes. Extrapolated to mammals, our results suggest that transcription factors play a comparatively more important role than histone modifications in the regulation of tissue specific genes. It has been shown that, in humans, tissue specific genes are more likely to be involved in diseases.

Are you able to speculate as to why developmentally regulated genes use a different epigenetic program compared to other genes?

What we call developmentally regulated genes correspond to genes with variable expression along time, which are often expressed only at a particular time point. Since development is a continuous process, one could speculate that rapid activation and de-activation of genes that are specific to a particular time point is more likely to occur without the need of modifying histone residues in chromatin.

What do you see as the most important next steps in this area?

Maybe the most important issue is to further challenge the model by investigating additional systems—in particular, mammalian systems—including differentiation processes, and additional histone modifications. The ultimate test of the model would come, however, from single-cell analysis, that is, from monitoring whether gene transcription does occur without histone modifications within the same cell. This is currently not possible given available technologies, but it may be feasible in the near future. It would be also important to investigate the role of distal enhancers, and of 3D chromatin structure, in the expression of developmentally regulated genes. Furthermore, we need to dig into the mechanism, by analyzing, for instance, how different classes of genes respond to perturbations of histone modification systems.


APOBEC3A takes the lead

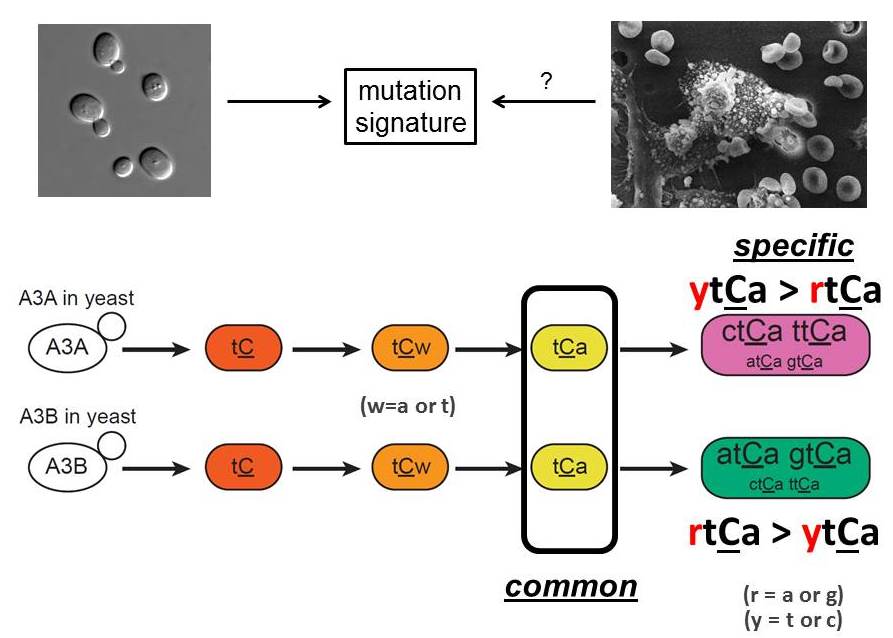
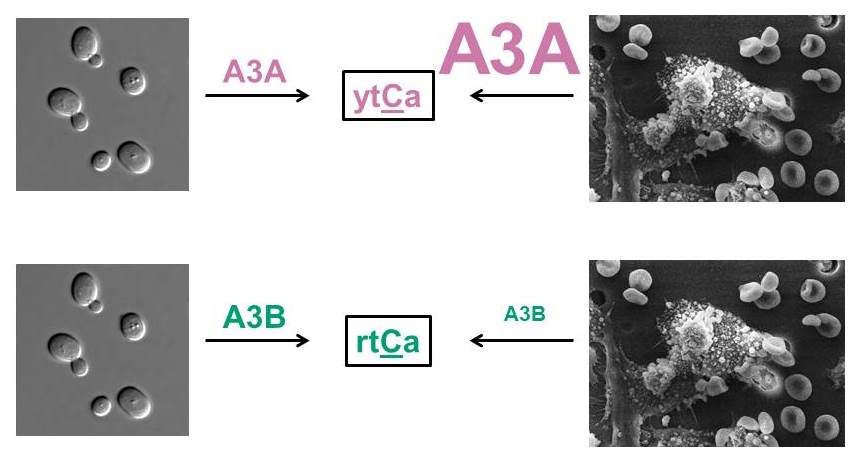
A3A and A3B mutagenesis signatures

A3A and A3B mutagenesis signatures{credit}Dmitry Gordenin{/credit}

A paper published online today in Nature Genetics reports that the DNA-specific cytidine deaminase APOBEC3A (or A3A) is likely to be the major driver of APOBEC-mediated mutagenesis in human cancer. This finding is somewhat surprising because another deaminase, APOBECA3B (or A3B), has been considered the more likely mutator based on previous studies. Gene expression levels of APOBEC3B as well as mutagenic signatures in certain cancer types, such as breast cancer, have been consistent with a primary role for A3B in cancer-related mutagenesis. However, results of a recent paper by Serena Nik-Zainal et al. called this into question by showing that breast cancer samples from individuals with germline APOBEC3B deletions showed high levels of mutations consistent with APOBEC-dependent mutagensis.

Now, Dmitry Gordenin and colleagues expressed either A3A or A3B in a yeast reporter strain that allowed them to collect large numbers of mutations induced by these enzymes. Mutations were identified using whole genome sequencing and compared between the two enzymes. They were able to demonstrate that A3A and A3B induce mutations at specific genomic sequence motifs that could be reliably differentiated. Surprisingly, A3A tended to induce many more mutations than A3B, approximately 10-fold more. With the mutagenic signatures of the two enzymes at hand, they were able to show that A3A contributes to APOBEC-dependent mutagenesis in human cancers and may in fact be the primary driver of these mutations.

Click the link below for a video summary of the paper (created in collaboration with the authors):

An APOBEC3A hypermutation signature is distinguishable from the signature of background mutagenesis by APOBEC3B in human cancers from Research Square on Vimeo.

We asked two authors of the paper, Kin Chan and Dmitry Gordenin, to give us a little more background about this exciting new research:

Given that APOBEC3A is expressed at relatively low levels in cancer samples (compared to APOBEC3B), what motivated you to study the potential role of APOBEC3A in cancer rather than any of the other APOBECs?

From the very beginning, we did not have very much hope that the level of mRNA in tumors at the time of surgical excision would correlate strongly with the detected number of mutations induced by APOBECs in these tumors, because mutations detectable by sequencing would have formed much earlier.  We showed that mutation load was only weakly correlated with transcript abundances of both APOBEC3A and APOBEC3B.  In fact, we did not particularly favor the APOBEC3A versus APOBEC3B dichotomy model with respect to the identity of the major mutator in cancers when we started our yeast experiments.  We just wanted to get more precise estimates of their signatures in our yeast system, which was designed to enrich for accumulation of multiple APOBEC-induced mutation clusters as well as detecting scattered mutations.
Why do you think the distinct signature of APOBEC3A was not identified in previous studies, for example the study by Taylor et al.?

Yeast system reporting mutagenesis in ssDNA identifiedcommon and specific  components of A3A and A3B mutation signatures

Yeast system reporting mutagenesis in ssDNA identified common and specific components of A3A and A3B mutation signatures
{credit}Dmitry Gordenin{/credit}

In fact, Taylor et al. did notice differences between mutation signatures of single-strand (ss) DNA-specific APOBEC3A and APOBEC3B cytidine deaminases separately expressed in yeast.  However, they had significantly fewer mutations caused by APOBEC3A, which is less of a mutator as compared to APOBEC3B in the proliferating yeast used in that study. Our yeast system was devised to enable the facile study of mutations induced by APOBECs in stretches of ssDNA formed during growth of yeast cultures, along with mutations caused in long persistent stretches of subtelomeric ssDNA formed in response to regulated telomere uncapping.  The latter form of ssDNA is hypermutable by APOBECs, which results in formation of mutation clusters (also called kataegis by other groups) that are so characteristic of hypermutation caused by APOBECs in human cancers.  It is worth noting that Taylor et al. noticed that some samples of breast cancer had mutation spectra resembling that induced by APOBEC3A, while other spectra were more similar to APOBEC3B’s.  However, the statistical approach they used did not provide sufficient power to highlight individual samples with statistically significant enrichment for certain mutation signatures.

A significant factor to our success was the use of an analytical design described in our previous papers (Roberts et al. 2012 and Roberts et al. 2013).  The essential idea of this design is that it uses all available mechanistic knowledge emerging from our yeast experiments and from studies of other labs to formulate a stringent statistical hypothesis, which is then used to interrogate cancer datasets.  This approach allowed us to compute robust sample-specific p-values even for exome mutation catalogues, which contain around 1% of mutation numbers characteristic of the whole genome mutation load.

Were you surprised by the result that APOBEC3A may be responsible for ten times more mutations in cancer than APOBEC3B?

We certainly were, because when we made this discovery we were thinking that APOBEC3B was more likely to be the major mutator in cancers.  But upon re-reading the literature, the finding that APOBEC3A is actually the culprit makes sense:  Three groups had independently shown that ectopic overexpression of APOBEC3A causes many DNA breaks while similar overexpression of APOBEC3B made much, much fewer breaks.  We think that an important reason for APOBEC3A’s mutagenic prevalence in cancers is that some of these breaks are repaired by mechanisms generating long ssDNA intermediates—in other words, APOBEC3A substrates.  This would also be consistent with previous observations that APOBEC-signature mutation clusters frequently co-localized with chromosomal rearrangement breakpoints in cancers.

What are your biggest unanswered questions related to this study?

It is clearly the question about what molecular mechanisms underlie this strong bias towards APOBEC3A in cancer hypermutation.  However, this may require years of studies by many excellent labs that have already developed and continue to productively explore this field. Our work not only highlighted the strong influence of APOBEC3A in cancer mutagenesis, but also confirmed that APOBEC3B makes its own contribution, perhaps in even more cancers than APOBEC3A.  We are interested to explore new larger data sets of cancer mutations becoming available through the recently announced Pan-cancer Analysis of Whole Genomes  project to elucidate the roles of these APOBECs in different cancer types, stages of cancer development and regions of cancer genomes.

 How do you see others using these results, either in research or in the clinic?

We hope very much that our findings will stimulate development of new assays to measure protein levels of individual APOBECs in cancers, which may turn out to be a better predictor of hypermutation and of clinically important tumor features.  APOBEC3A- and APOBEC3B-specific antibodies required for such assays are still to be developed.  Another important area is biochemical studies of both enzymes, which may clarify why one of them can cause DNA breakage, while the other does so only inefficiently.  It will also be interesting to identify the interacting proteins that keep APOBEC3A in the cytosol of healthy cells, as this could lead directly to the reasons for APOBEC3A essentially going rogue and entering the nucleus to hypermutate genomic DNA in cancers.

As for clinical applications, determining the APOBEC mutagenesis signature of a tumor could inform decision making on personalized medicine:  a tumor where APOBEC3A is actively causing hypermutation might have to be treated very differently from a tumor where there is only APOBEC3B background levels of mutagenesis.  Screening for APOBEC signature mutagenesis in cell-free DNA for individuals at high risk (for example, patients with germline deletion of APOBEC3B) might be a useful early warning diagnostic in the near future.  Also, it’s straightforward to propose that a specific APOBEC3A inhibitor might be of value for personalized medicine, more so than a broad-spectrum APOBEC inhibitor, which would likely severely compromise innate immune function. In a more speculative sense, the idea of overexpressing an APOBEC in order to kill cancer by hypermutation catastrophe has been around for a while in the field.  The latest news in cancer research is that some hypermutated cancers are more susceptible to immune treatment than tumors with lower mutation loads.  The suggested explanation is in the creation of neo-antigens that trigger immune attack on the tumor.  Interestingly, therapeutic overexpression of APOBEC3A might combine this hypermutation effect with DNA breakage – a feature of several established cancer drugs.

Sidestepping spurious associations

Robert_Delaunay,_1913,_Premier_Disque,_134_cm,_52.7_inches,_Private_collection

Layers of structure {credit}Robert Delaunay, 1912-1913, Premier Disque{/credit}

Genome-wide association tests have been hugely successful at finding genes and even specific mutations that contribute to traits ranging from human height to schizophrenia. At its most basic, the idea is that a group of individuals with a shared phenotype should also share some genetic variants in common that are causally related to the trait in question. Unfortunately, there are other reasons that individuals who share a trait, such as cardiovascular disease or epilepsy, might share genetic variants in common. For example, a gene might seem to be associated with epilepsy within a given population, but it may be that a subgroup of the affected individuals shares a common ancestry that they aren’t aware of, and the associated gene may simply reflect that fact.

Researchers have of course been aware of this problem for a long time and genome-wide association studies (GWAS) are now designed to account for hidden population structure. However, these methods are not perfect. Finding ways to improve GWAS methods is an active area of research.

A study published online in Nature Genetics this week reports a new sophisticated method for performing GWAS while automatically accounting for hidden population structure. The study by Minsun Song, Wei Hao and John Storey demonstrates the power of their method, the genotype-conditional association test, first on simulated data and ten shows how it can be applied to large genotype datasets for both quantitative and binary traits. We asked the senior author, John Storey, to tell us a little bit more about the study.

Questions with John Storey: 

Many statistical methods exist for accounting for population stratification in genetic association tests. What makes your genotype-conditional association test different?

The genotype-conditional association test (GCAT) is different operationally because it fits a statistical model where the variation in genotypes is explained in terms of the trait variation and adjustments for population structure.  This means that the genotype and trait variables are swapped when performing the statistical regression, and a different type of regression (logistic regression) is used.

GCAT is also different because we have provided a theoretical proof that the test controls for general forms of population structure.  To our knowledge, before this paper, there has been no theoretically proven way to account for general forms of structure in population-based studies without relying on approximations.  An important, distinguishing feature of our method is that the key assumption one needs to verify on real data is about the model used to capture population structure observed in the genotypes.  This can typically be verified in practice, and there has been a lot of great work on this topic over the years, so there are plenty of existing resources available to properly model structure itself.  GCAT does not require extensive assumptions about the trait model to be verified, including non-genetic effects, which is often impossible to do in practice.  Finally, GCAT can computationally scale to very large sample sizes, on the order of a million individuals.  Methods that require estimating a kinship matrix cannot currently scale to very large sample sizes.

How did the initial idea for this method come about?

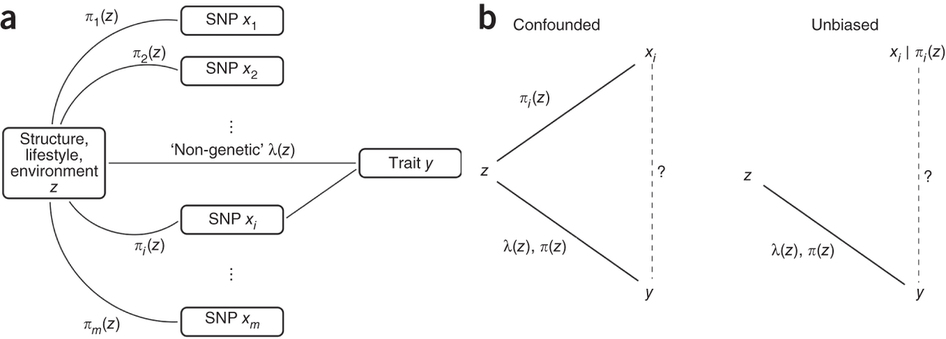
Figure 1 in the paper essentially captures the initial idea.  We wanted to develop a method that (1) allows for very general trait models, including genetic and non-genetic effects that are highly confounded with structure, and (2) involves estimating parameters and models that require few assumptions and can be verified in practice.  As the project developed, we really grew to appreciate the linear-mixed effects model approach and we viewed our research as a useful way to look at the problem from another perspective.

Rationale for the proposed test of association.

Rationale for the proposed test of association.{credit}Figure 1, Song et al (2014) Nature Genetics published online 30 March 2015; doi:10.1038/ng.3244{/credit}

Who do you think will most benefit from this new method and why?

Since our method allows for more general assumptions about the trait model, a researcher who is uncomfortable with the assumptions that current methods make about the trait model will benefit from the new method.  A researcher who has a large sample size will also have an easier and shorter time performing the method (which has software available on GitHub at https://github.com/StoreyLab/gcat).  The theory that supports our method also applies to other distributions on traits, such as the Poisson, Negative Binomial, or Exponential distributions, so our method is capable of considering more exotic traits such as RNA-seq profiles.  Finally, I think the theoretical work in the paper will be helpful to anyone wanting to be exposed to a different understanding of the problem.

What types of association tests would this method not be appropriate for?

If a study involves closely related individuals, then the method is not appropriate for it.  However, the user should easily discover this when verifying whether the model of population structure fails to properly explain the genotype data.  We would have to do further work to see if GCAT can be extended to the case of related individuals.

What problem(s) still needs to be solved in genome-wide association testing?

I will just comment on statistical methodology problems.  It is still early days on figuring out the best way to analyze multiple traits simultaneously or how to best analyze very large sample-size studies (typically as meta-analyses).  We are interested in GWAS that involve many simultaneously measured molecular traits that may involve lots of challenges such as population structure among the individuals and batch effects in the molecular profiles (e.g., the GTEx study).  GCAT was a step in this direction for us.  I also think that kinship matrix estimation needs some additional work (especially for large sample sizes) and I personally am not yet satisfied with how we deal with polygenic models in GWAS.  Finally, I think that coming up with ways to utilize more functional genomics and pathway information in a GWAS is a great direction.

You recently became the director of the Center for Statistics and Machine Learning at Princeton. How has this changed your interaction with other faculty involved in the center? Have there been any unexpected or surprising results of joining up these two disciplines at Princeton?

There has been broad and extremely enthusiastic support at Princeton University for building the Center for Statistics and Machine Learning.  It seems that every major discipline has significant research activity that is data-driven, even in the humanities (e.g., our Center for Digital Humanities).  It has been a pleasure to learn about the wide range of “big data” research happening on campus and to be able to think about how we can build the Center to enhance all of this activity.  There has been a core of faculty members at Princeton for years who primarily work in statistics and/or machine learning, so we are all thrilled to have an established intellectual home now..


On the history of pigs

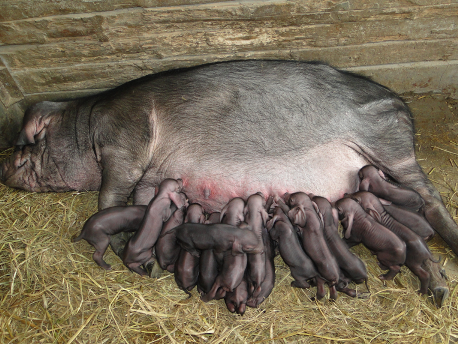
USDA_ARS_Meishan_pig-Cropped

{credit}Agricultural Research Service via Wikipedia{/credit}

Understanding the genomic changes that occurred during the domestication of animals and plants by humans is important on many levels. Such insights can provide information about human history and our interactions with other species, as is the case with genetic studies of dog and cat domestication. These studies can also help us to improve crop plants (such as tomato) and livestock (such as cattle) for human consumption or other use. Finally, genetic studies on domestication can help to identify disease-causing mutations that have been selected for as a by product of selection for beneficial traits (for example, in cats and dogs).

Though humans have a huge influence on important traits in domesticated species, those species are still responding to natural selection during the domestication process, which in turn may affect traits important for agricultural purposes. Identifying genomic regions influenced by positive natural selection in domesticated animals  can lead to important insights into the biology of specific breeds.

In this respect, the pig is an excellent model to study. Humans domesticated pigs approximately 10,000 years ago in the Near East and China, but a relatively open method of keeping pigs allowed for continued interbreeding with wild boars for some time. In a study published this week in Nature GeneticsLusheng Huang, Jun Ren and colleagues from Jiangxi Agricultural University sequenced the genomes of 69 diverse domestic and wild pigs in China to better understand their evolutionary history.

Pig sampling in China

Pig sampling in China{credit}Lusheng Huang{/credit}

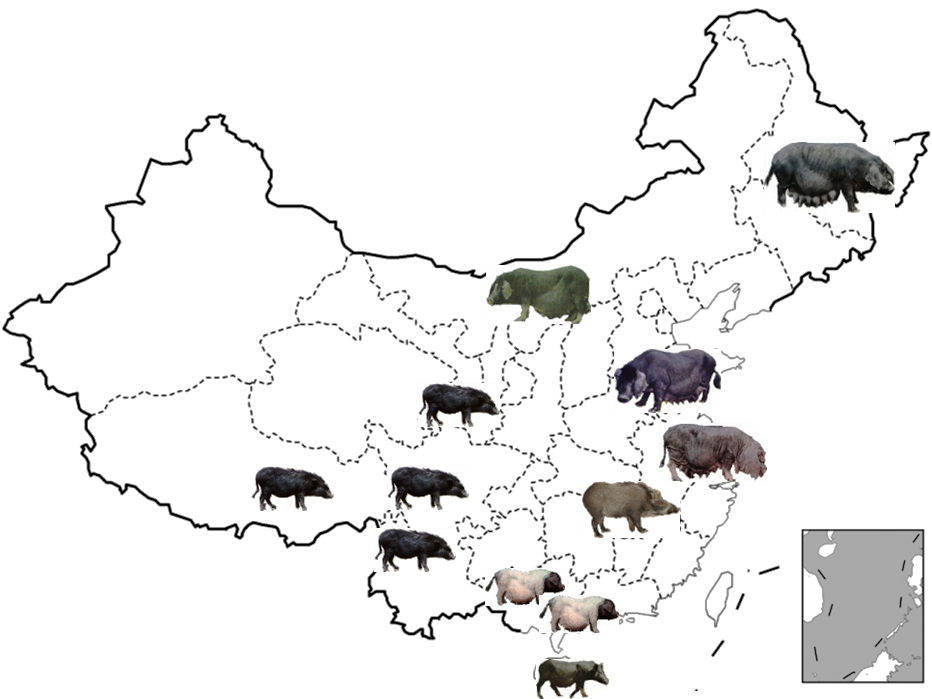
The study included pigs from 11 diverse breeds (and 3 populations of wild boar) within China in order to compare the adaptations in breeds from cold vs. hot areas. They identified over 700 genomic regions that showed evidence of selective sweeps. Many of the genes in these regions were involved in processes important for regulation of temperature during cold or heat stress, such as hair development, energy metabolism and blood circulation.

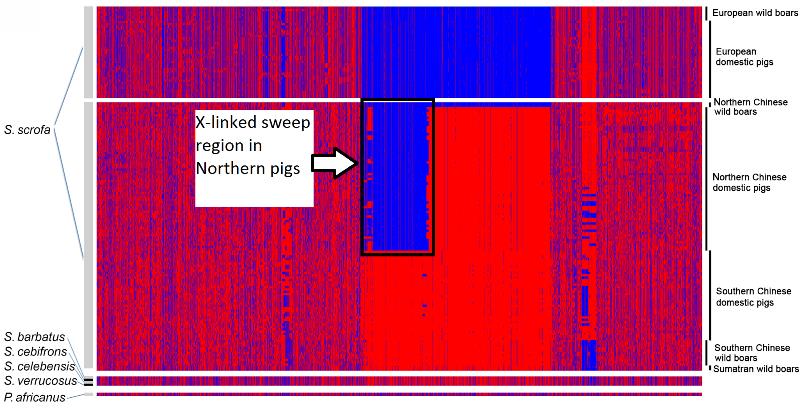
However, one of the most striking results was the identification of a large (~14Mb) sweep region on the X-chromosome. More than 94% of the single nucleotide polymorphisms (SNPs) in the 69 pig sample that had extreme allele frequency differences between North and South populations were located within the X-linked sweep region. All Northern Chinese samples showed a strong signature of selection in this region. Upon further analysis, the authors were able to determine that the most likely scenario, given their data, was that this region was introgressed from a now-extinct species of Sus. This region of the X-chromosome undergoes very little recombination. This fact, combined with the strong signal of positive selection in the region, meant the introgressed sequence remained mostly preserved for more than 8 million years.

We asked one of the study’s senior authors, Lusheng Huang, to tell us a little more about the work:

How did you collect the DNA samples from the pigs for your study? Were any of the samples difficult to get?

We collected DNA samples from 4,100 three-generation consangeneously unrelated pigs representing all 68 indigenous breeds that are distributed in 24 provinces of China. It took us four and half years to complete sample collections, Some native pigs lived in the high attitude regions (Yunnan, Guizhou, Sichuan and Tibet) were very hard to get. Afterwards, we constructed a DNA bank for Whole China indigenous pigs. As a pilot study, we first genotyped 520 unrelated pigs (no common ancestor within 3 generations) from 32 Chinese breeds for 60K SNPs in the Illumina porcine beadchip. Then, we selected 69 representative pigs from the 520 pigs according to their genetic relationships in the neighbor-joining tree constructed with the 60K SNP data. The 69 pigs selected for whole-genome sequencing are highly rep­resentative of populations at the geographical extremes of China.

pig sampling

{credit}Lusheng Huang{/credit}

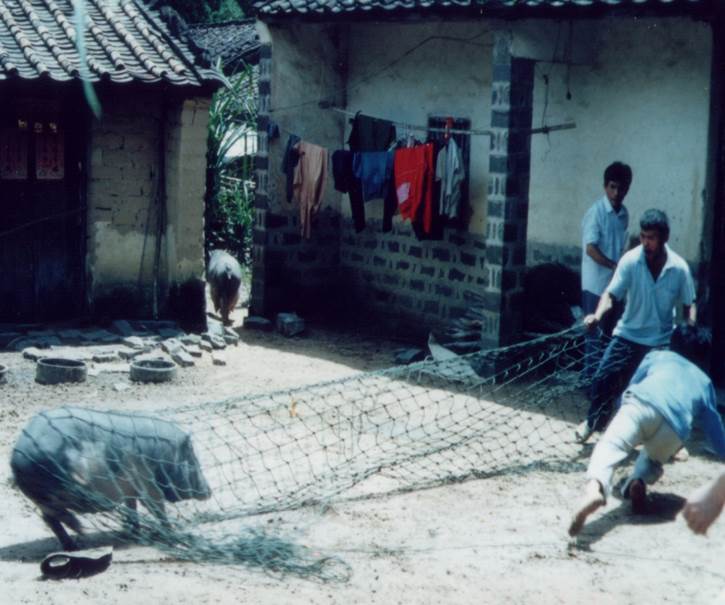
Most of the sampled pigs were originally raised in government-sponsored conservation farms. We selected animals to cover a majority of consanguinity of each breed according to their pedigree information. However, samples of several breeds were collected from isolated villages or farms at rural areas. For example, it was a big challenge for us to collect samples of Tibetan pigs from different geographic populations in the vast region of the Tibet Plateau. To find purebred Tibetan pigs that were not influenced by human-mediated hybrid with exotic breeds, we had to travel to remote pastoral areas at high altitudes and make an in-depth field investigation with the kind help of local residents. To cover the consanguinity of each Tibetan population as broad as possible, we preferably collected samples from Tibetan boars that are usually aggressive like wild boars and were really difficult to get (see above picture).

What do the positively selected regions tell us about the history of pig domestication?

These regions clearly illustrate that pigs have experienced natural selection for local fitness before (ancient event) or after (recent event) domestication. The selection footprints in the pig genomes can be visualized by whole-genome sequencing, characterized by reduced heterozygosity, excess of low-frequency variants, extended and differentiated haplotypes. The selected sweep regions harbor functional genes that play a role in adaptation to local environments. DCF17 and VPS13A are two such examples highlighted in this study.

What do you think was the most unexpected result in this study? Did you believe it at first?

The extremely divergent haplotype in the X-linked sweep region between Southern and Northern Chinese pigs, an indication of a possible ancient interspecies introgression event, was the most unexpected result in this study. It is a big surprise. Frankly speaking, we did not believe it at first.

Adapted from Fig. 4a in Huashui Ai et al. 2014

The pattern of haplotype sharing in diverse populations. The haplotypes were reconstructed for each individual using all of the variants on the X chromosome. Alleles that are identical to or different from the ones in the Wuzhishan reference genome are indicated by red and blue, respectively. Adapted from Fig. 4a in Huashui Ai et al. 2014{credit}Nature Genetics{/credit}

Why is the finding of a large introgression region on the X chromosome important?

Although evidence of adaptive evolution driven by introgression from archaic species has been recently identified in some species including humans, the X-linked introgression region shows that adaptive introgression is not limited to closely related species, but in some cases, introgression with very divergent species can provide the basis for the evolution of radically new traits in a species. This radical example of so-called ‘reticulate evolution’ in mammals shakes the foundation of most modern evolutionary biology and provides a new view of adaptive evolution that emphasizes saltationist (sudden) processes driven by introgression. Moreover, as discussed in the paper, our ability to detect this, potentially quite old, introgression event is facilitated by the fact that the introgression fragment falls in a recombination-decreasing region. This has allowed the introgressed haplotype to be maintained for a prolonged period. Our results may suggest that introgression generally plays a much more dominant role in adaptive evolution than previously thought, but has been difficult to detect because introgression fragments in other systems degenerate quickly due to recombination.

Do you think similar ancient introgressions have occurred in other domesticated species? If so, how would you test this?

We cannot rule out the possibility. If one wants to test this hypothesis, we would suggest to use a research strategy similar to that used in this study. First, we would need to get the genome sequences of multiple species divergent from a domesticated species. Then, we can perform a genome-wide scan for possible introgression regions from another divergent species in the domestic species. Several statistics of ABBA, F4, haplotype sharing and phylogenetic analysis can be explored to identify such ancient introgressions.

Erhualian

{credit}Lusheng Huang{/credit}

Bonus question: What is your favorite breed of domestic pig?

Erhualian, the most prolific pig breed in the world.

A piggyBac ride to pancreatic cancer genes

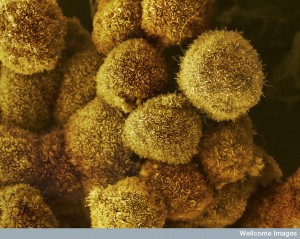
A cluster of pancreatic cancer cells. Scanning electron micrograph

A cluster of pancreatic cancer cells. Scanning electron micrograph{credit} Anne Weston, LRI, CRUK. https://wellcomeimages.org{/credit}

Pancreatic cancer is a highly heterogeneous disease that often has a poor prognosis. Development of drugs or treatment strategies to target cancers, including pancreatic cancer, depends on identifying the drivers of disease. These are the genes that promote carcinogenesis and coordinate development of the cancer. But by the time a patient is diagnosed, it can often be very difficult to tell which of the many mutations present in the tumor are actually disease drivers, and which are just along for the ride.

A new paper published in Nature Genetics describes a strategy for finding the genetic drivers in pancreatic cancer. The authors used a forward genetic screen in mice that targets a particular transposable element, the piggyBac transposon, to the pancreas. When the transposon inserts itself into the genome, it disrupts genes, causing mutations that may then lead to cancer. By using the screen in “sensitized” mice (i.e., mice with particular mutations that will accelerate disease progression), the authors were able to cause pancreatic tumors to form in the mice. The genetic changes in these tumors were then examined to identify which genes are most often targeted by the transposon.

Other studies have been published recently that use a similar approach to find drivers of other types of cancer. Neal Copeland, Nancy Jenkins and colleagues pioneered the use of Sleeping Beauty transposon mutagenesis to screen for genes important in cancer, including a recent study in liver cancer associated with hepatitis B. Rama Khokha and colleagues recently used the Sleeping Beauty mutagenesis method to identify driver genes responsible for the formation of sarcomas.

These screens have been very successful; there have even been Sleeping Beauty screens for pancreatic cancer driver genes (here and here). However, Roland Rad and colleagues found that a Sleeping Beauty transposon screen was not ideal for studying certain types of pancreatic cancer. In addition, Sleeping Beauty and piggyBac have different insertion preferences, so the tools complement one another. This means that, while some sets of genes identified with the two methods do overlap, there are other genes that can only be found by using one or the other methodImportantly, Dr. Rad and colleagues observed different histological subtypes of pancreatic cancer in mice when using piggyBac, which were not observed using Sleeping Beauty.

We asked Dr. Rad, one of the lead authors of the study, to tell us a little more about the paper.

For readers unfamiliar with insertional mutagenesis screens, could you tell us what a piggyBac transposon is and how it was discovered?

Transposons are mobile DNA segments that can move around the genome. They were first discovered by Barbara McClintock more than 50 years ago. The DNA transposon piggyBac encodes a transposase, which moves the transposon from one genomic locus to another by a cut-and-paste mechanism. Transposable elements, which have been widely used for genetic screening in bacteria, yeast, arthropodes and nematodes, had been inactivated during vertebrate evolution and were hence not available as genetic tools in higher organisms until recently. Successful efforts over the past ten years to make piggyBac work in mammalian cells motivated us to target it to the mouse genome and test its applicability for somatic mutagenesis in mice.

Lifecycle_of_the_Piggybac_Transposon_System

The PB transposase recognizes the specific inverted terminal repeats (ITRs) at each end of the transposon. PB then “cuts” the transposon out of its original location and moves it to a new, random location in the genome with a TTAA sequence. {credit}Transposagenbio via Wikimedia Commons{/credit}

How do screens like this (performed in mice) inform us about human cancer? What is the advantage of this approach over direct sequencing of patient tumors?

Genetic screening and cancer genome sequencing are highly complementary approaches. Sequencing and array-based analyses of patient tumors can very accurately identify all classes of somatic alterations in cancer. However, many of these changes are difficult to interpret. For example, hundreds or even thousands of genes are found to be transcriptionally or epigenetically dysregulated within a single patient´s tumor, meaning that they are not mutated but just being turned on or off. Pinpointing the few cancer-causing events among these large gene sets is extremely difficult. Likewise, copy number variation in cancer often affects large chromosomal segments, and for 75% of commonly amplified or deleted regions in human cancer, the cancer-causing genes have not yet been identified.

PiggyBac screening can tremendously facilitate this “search for the needle in the haystack” because transposons jump directly into the relevant genes. Even if a cancer gene is unequivocally identified through sequencing (for example based on its mutation), understanding downstream complexity can be difficult. Many cancer genes (e.g. methyltransferases, histone modifying enzymes, DNA repair genes) have large numbers of targets. Others (e.g. Ras) have many effector pathways that are used differently in various cancer types or have numerous interaction partners. Here again, unbiased genetic screening can identify ‘players’ at all levels of these cascades and can directly pinpoint important downstream effectors. Moreover, genetic screening provides a first level of biological validation of cancer genes and functional insights at an organismal level. These are some examples, which show that transposon-based screening can answer biological questions that cannot be systematically addressed by other approaches to cancer genome analysis.

What was the most surprising aspect of this study?

The screen produced numerous unexpected results. This is the beauty of a hypothesis-free forward genetic approach. We have discovered a large set of novel transcription factors involved in pancreatic cancer and shown that transposons can be used to identify cancer-relevant non-coding regulatory regions in the genome. The study also showed that insertional mutagenesis can induce different subtypes of pancreatic cancer and can dissect underlying genetic causes.

What was the biggest challenge your group faced during the course of the study?

The biggest challenge was to make the system work in mice. PiggyBac originates from Trichoplusia ni, the Cabbage moth. We modified PiggyBac and introduced it into the mouse genome. Naturally, we did not have a priori knowledge as to how the system would behave in the mouse. Will it be efficient enough to achieve transposition? How many transposons per cell will we need to achieve tumor induction in individual tissues? Do high transposon copies induce toxicity? How will the genetic elements (enhancers, gene trapping elements etc.) affect the phenotype? We addressed these questions by developing many different transposon mouse lines and systematically exploring PiggyBac’s characteristics in vivo.

How do you see your results being used in the future by other researchers or clinicians working with pancreatic cancer?

The study has produced rich biological insights and large sets of putative novel “players” in pancreatic cancer. Researchers will use this knowledge and take individual aspects further, e.g. perform in depth analysis of individual genes discovered in our screen or test whether they are targetable. Our genome-wide screen adds further pieces to pancreatic cancer´s “puzzle” in order to better understand the complexity of the biological processes driving tumorigenesis. We hope that this will ultimately help guide the development of novel therapeutic strategies.

You can find the paper describing this study here. More information about Dr. Rad and the piggyBac transposon system can be found here

Uncovering the secrets of the orchid

It seems that every day, another species of plant or animal is being sequenced. How do scientists choose which species should have its genome sequenced?

For some, such as African rice, the main consideration is whether the genome sequence will allow for improvement of agriculturally important crops. For others, including the marmoset, the interest lies mainly in the connection to human evolution.

Phalaenopsis_equestris_var._leucaspis_small

{credit}Wikipedia{/credit}

Now, Zhong-Jian Liu at the National Orchid Conservation Center of China and colleagues from around the world have sequenced the genome of the orchid Phalaenopsis equestris. Besides being a popular ornamental plant (and therefore a commercially important plant) with gorgeous flowers, the orchid has another unique claim to fame. This species uses a type of photosynthesis that is different from all other plant species sequenced to date.

Orchids use a photosynthesis strategy called crassulacean acid metabolism (CAM). CAM plants make up approximately 7% of plant species. Other notable CAM plants include cacti (such as the saguaro—a native of my home state, Arizona), agave (where tequila comes from), aloe vera and pineapple.

Most plants use the C3 metabolic pathway to turn carbon dioxide (CO2) into energy (there is also a third pathway, called C4, used by about 3% of plant species). All plants use sunlight and water to incorporate the carbons from CO2 into sugar, producing oxygen as a byproduct. When it is very hot or dry, C3 plants are at a disadvantage because they cannot efficiently use carbon due to a process called photorespiration. CAM plants are specifically adapted to these extreme environments. Their specialized leaves chemically store the carbon from CO2 acquired during the night and use it for photosynthesis during the day (when their stomata are closed, to prevent water loss) .

Many orchids, such as the species sequenced in the new paper, are epiphytes, meaning that they do not get their water from roots in the soil, but rather from the air or rain. They would therefore need to budget their water supply. This adaptation is likely related to their use of CAM instead of C3 metabolism.

In the genome paper, the authors identified genes important for CAM and analyzed their evolutionary history. They also analyzed genes involved in flower development, to better understand how orchids develop their spectacular flowers. The paper is certain to be an important resource for future studies of plant evolution and adaptation.

We asked one of the senior authors of the paper, Zhong-Jian Liu, to tell us a little bit more about the background of this study.

Can you tell us a little about the National Orchid Conservation Center of China?

The National Orchid Conservation Center of China was established in 2006 and is located beside Wutong Shan Mountain and Shenzhen reservoir, which is a very good location for the growth of orchids. The center is aimed at conducting the conservation of Orchidaceae germplasm, improving the level of orchid protection and advancing the cause of orchid conservation in China.

The center now owns the most endangered orchid species in China and there are more than 1,000 Chinese orchids belonging to international and national first and second-class protective orchids. There is a herbarium, tissue culture room and special library for orchids at the center. The herbarium has 3,835 specimens and 110 type specimens of orchids, and 243 animal and plant fossil specimens related to orchid evolution, which is the most in China. More than 1,800 books and 20,000 audio-visual documents are stored in the library. In academic research, 187 papers and 14 monographs have been published in China and abroad. “Pollination: Self-fertilization strategy in an orchid” was published in Nature and summarized by Year in Review 2006 and included in Book of the Year 2007 by Encyclopaedia Britannica.

The orchid genome represents the first genome sequence of a CAM plant. Why do you think this is so significant and how will it affect plant research in the future?

The CAM pathway for photosynthesis is indeed of importance. It not only leads to more efficient power conversion, but also strengthens the adaptation to harsh environments, especially drought, in comparison with C3 plants. Meanwhile, research of CAM can provide new directions for breeding programs to produce neo-species with drought resistance.

In our manuscript, we found gene duplication and loss events in four of the six key gene families in the CAM pathway. These events are important to the adaptation and evolution of orchids.

What was the most surprising result of the study and why?

We consider the finding that Orchidaceae has undergone an orchid-specific whole-genome duplication (WGD) event to be the most intriguing result. WGD can trigger a tremendous burst in gene diversification within quite a short period, which provides extensive gene material for neo-functionalization, sub-functionalization or dosage strengthening. All of these outcomes can give rise to diversity in morphology, metabolism, live style, etc. that can finally result in tremendous species radiation. We think the WGD event may be linked to the success of the orchid family. There are more than 20,000 species of orchid within 880 genera.

What was the most difficult part of the study?

The unexpectedly high heterozygosity rate in the orchid genome was the most challenging aspect for us. It is extremely difficult to assemble its genome using the raw reads. But we finally overcame this difficulty via the use of diverse assembly software packages, optimization of their core parameters and verification with the complement of the BAC sequences. Finally, we accomplished a very accurate, complete genome assembly.

There have been other genomes published with a similar level of heterozygosity to our genome, but we  were able to achieve a much more accurate and complete assembly than was the case with those genomes.

Paphiopedilum Armeniacum

Paphiopedilum armeniacum flowers {credit}Stefano via Flickr.com{/credit}

Do you have a personal favorite type or color of orchid?

I love all the species and colors of orchids very much. If there was one for me to choose, it would be Paphiopedilum armeniacum. I like its beautiful pale yellow flowers, which I have sometimes thought symbolize a yellow Chinese dream.

The genetic syntax of febrile seizures

The genetics of seizure disorders, including epilepsy, has recently come into the spotlight (see the Nature Outlook on epilepsy). Epilepsy is a complex disease with many different subtypes, both sporadic and familial. While epilepsy is one of the most common neurological disorders, and it has been studied for a very long time, the underlying mechanisms of seizure disorders remain largely elusive. Identifying the genetic causes of different subtypes of the disorder can help to illuminate the gene networks involved and lead to a deeper understanding overall. Importantly, the genetic tools now exist to identify causal mutations for the many different subtypes of seizure disorders.

Febrile seizures, which are induced by fever, affect approximately 2-4% of children worldwide. This type of epileptic seizure is often triggered by infectious disease, but there is strong evidence that it has a genetic basis. A paper recently published in Nature Genetics by Bjarke Feenstra identified two genes associated with vaccine-induced febrile seizures (vaccines, such as MMR, are an extremely rare cause of febrile seizure).

Protein model for STX1B

Protein model for STX1B{credit}Wikipedia{/credit}

Now, a study by Holger Lerche, Camila Esguerra and colleagues identifies variants in the gene STX1B as causing a familial form of febrile seizure disorder. STX1B encodes a protein called syntaxin-1B. Syntaxin-1 is a key component of a protein complex necessary for the release of neurotransmitters from the presynaptic membrane.

The authors first identified two families in Germany with a history of febrile seizures. They used a combination of whole-exome and whole-genome sequencing to identify the gene most likely to harbor pathogenic mutations causing the disorder. Targeted sequencing in an extended cohort identified further variants in STX1B in patients who had experienced febrile seizures.

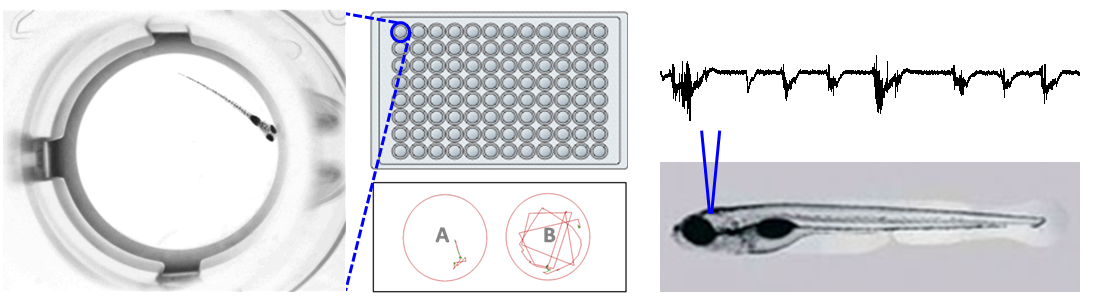
To validate these findings, the authors tested the function of stx1b in zebrafish, and showed that a reduction in syntaxin-1B led to behavioral defects in the fish, such as lack of touch response, fin fluttering and jerking movements. Recordings of brain activity confirmed that the fish were experiencing epilepsy-like symptoms. You can read a more in-depth summary of the paper in a blog post at Beyond the Ion Channel by one of the study’s co-authors. 

We asked one of the study’s senior authors, Holger Lerche, to tell us a little more about the background of this study:

How did you initially become interested in studying seizure disorders?

I was working during my thesis with mutated ion channels in rare muscle diseases. When I started with my Neurology training, epilepsy emerged as a highly interesting topic in that field as well, and also clinically I became very interested in epilepsy.

How did the two families in this study first come to your attention?

The index case of the first family was referred to me during a cooperation with the Children’s Hospital (at that time at the University of Ulm), when I was looking for familial cases with epilepsy for genetic studies. When I called his grandmother, it turned out to be a large pedigree further increasing when contacting and visiting the different branches of the families. The second family was referred to my colleague Yvonne Weber for similar reasons from another Children’s Hospital in Germany.

STX1B mutations have been associated with other forms of epilepsy. How does the association with febrile seizures further the understanding of this gene’s function?

The function of this gene has been explored very well already by Nobel Laureate Thomas Südhof and his group. The mutations we detected may teach us more about the functional role of different protein domains and their interaction with other proteins in the vesicle release machinery. It is not surprising that mutations in STX1B cause epilepsy, but how febrile seizures develop is still an enigma. Follow-up studies of our discovery may shed light on the unknown temperature-sensitive mechanisms leading to febrile seizures.

Do you think there is the potential for developing drugs targeting STX1B in these patients?

The question is how the loss of function of one allele of STX1B could be compensated. If targeting STX1B to enhance its production or activity is possible, and if this may help these patients, is difficult to predict. However, the zebrafish model can also help us to find therapies which work in a completely different way to compensate for STX1B failure (see answer to next question).

Can you say a little about why you chose zebrafish as a model, and what you learned from this model organism that you wouldn’t have been able to learn otherwise?

We started only recently to collaborate with Camila Esguerra and Alex Crawford who have the zebrafish facilities and expertise. It is a vertebrate, easy to study and very quick to manipulate (much quicker and easier than mice).

Behavioral assays (left) and electrographic recordings of zebrafish brain (right)

Behavioral assays (left) and electrographic recordings of zebrafish brain (right){credit}Courtesy of Alex Crawford and Camila Esguerra{/credit}

To establish a cellular model for functional proof of these mutations would have been more difficult in our case. And the zebrafish is an in vivo model, so we can study behavior and EEG, which is not possible in a cellular assay. Also the temperature effect could be studied very nicely with an effect on EEG in an in vivo system.Last but not least, and most important when thinking of the impact of our work: zebrafish models can be used to find new drugs in medium to high throughput screens using seizure-like behaviour or EEG as read-outs. This allows us to find different kinds of drugs that are able to antagonize the consequences of the STX1B defect on a system-wide level.

Read the full study by Lerche and colleagues here. You can also read more about this work here [press release]. 

Finding the hidden variation in the human genome

A new method from researchers at the Broad Institute improves variant discovery in the human genome.

A new method from researchers at the Broad Institute improves variant discovery in the human genome. {credit}Webridge via Wikipedia{/credit}

Identifying novel sequence variants is a crucial first step toward understanding the genetic basis of many diseases. However, current methods for variant calling, while very good in general, miss the variants in about 10% of the human genome. This 10% of the genome presents unique challenges, such as high GC content, low-complexity sequences and duplications.

In a paper published online this week at Nature Genetics, David Jaffe and colleagues present a two-hit improvement over existing methods. First, they modify existing methods for generating 250bp paired-end reads using a PCR-free protocol. Because PCR amplification isn’t used, the method significantly reduces coverage bias in the final sequence. Second, they present a new algorithm, called DISCOVAR, that is specifically designed to analyze these data and to call variants in the trickiest parts of the genome.

As proof-of-principle, the authors apply their methods to identify all sequence variants in approximately 4MB of  sequence from the human cell line GM12878, as compared to the human reference sequence. They found that the Illumina Platinum variant call set, which was based on 100bp reads, actually missed about 25% of the variants, mostly due to low coverage in challenging genomic regions.

The new sequencing and assembly method is comparable in cost to existing methods and paves the way for significant improvements in disease-associated variant discovery. We asked the study’s senior author, David Jaffe, to tell us a little more about the background of this work.

Your background is in mathematics, but you became interested in bioinformatics about 15 years ago. What inspired you to apply your skills to biological problems? What was the major difficulty you encountered in switching fields?

Well, suppose you had been a bricklayer for twenty years. It’s good, but after a while your love affair with the bricks wears off. And then you see this new exciting thing that you can do, that people seem to care a lot about. So you jump.

As for the major difficulty, imagine you’re making a change but you don’t really know anything about the new field—and other people know that! So you have to really listen to what they have to say, and hang in there.

How did the idea for DISCOVAR initially come about?

What our group does is look for ways to combine laboratory and computational improvements so as to achieve a better view of the genome (without breaking the bank). broad-logoWe’re always looking for new approaches, and the Broad is a good place to do that because there is a lot of lab innovation and the culture encourages lab/computational interaction. In the summer of 2012, we first saw 250 base-pair reads generated from PCR-free libraries (using Illumina technology), and we realized that these data had enormous power. So we set about designing an algorithm that might work exceptionally well on this data type. Also, we had two generations of assembly algorithms under our belt (ARACHNE and ALLPATHS-LG) and knew we could do better. The DISCOVAR laboratory protocols are available online at our DISCOVAR blog.

What was the most surprising result of your study?

The most surprising thing was the level of contiguity and completeness that could be achieved in local assemblies. The older methods yield a break every 20kb or so, but the new methods just keep going. One reason is that we no longer had PCR dropouts, loci with little or no coverage. Also much of our computational effort went into error correction that could correct almost any sequence, reducing the incidence of assembly holes attributable to polymerase slippage.  Consequently, in most cases, it would be possible to find nearly all the differences with a reference genome.

The DISCOVAR algorithm is designed to work on a specific type of sequencing data—is this sequencing method commonly used, or do you envision it becoming so? Do you think DISCOVAR could become the gold standard for variant calling?

Nearly concurrent with publication, Illumina announced official support for 250 base reads, thus eliminating the need to hack their protocol. We think people will switch because the new data give better results! Variant calling covers a lot of ground. For example, there are very good (economic) reasons why people will still want to sequence exomes. But for cases where the goal is to get a nearly complete inventory of all genomic changes, we think we have the best tool to date.

Image from the DISCOVAR demo site. The magenta edge represents a 30 kb heterozygous insertion in the reference sequence.  Each edge represents a DNA sequence. Red vertices “continue on” in full graph.

Image from the DISCOVAR demo site. The magenta edge represents a 30 kb heterozygous insertion in the reference sequence. Each edge represents a DNA sequence. Red vertices “continue on” in full graph. {credit}David Jaffe{/credit}

What were the major hurdles, if any, during the course of this research?

Squeezing the maximum information from the data is just a really hard problem, depending on the fine detail of the data properties (like exactly what sorts of sequences did we get wrong, and why). But to know right from wrong, we had to build a set of reference sequences for our control sample (NA12878), and getting these exactly right was itself a significant undertaking. All of this required an R&D effort with many iterations.

Bonus question: What does the name “DISCOVAR” stand for? Who came up with the name?

Coauthor Iain MacCallum came up with DISCOVAR, which stands for “discover variants.” We actually went through a series of other names first. We thought about Varitas, but somebody else was using it and we thought Harvard might sue us (ha ha). We found a similar name that nobody was using, but dropped it after a colleague told us its street meaning in Brazil…

Click here to read the full paper describing DISCOVAR

Make sure to check out the DISCOVAR blog from the Broad Institute and the online demo tool!

How we built a better tomato

One species of wild tomato, Solanum lacerdae

One species of wild tomato, Solanum lacerdae{credit}Sandy Knapp{/credit}

Most wild tomato species bear little resemblance to the large, red fruits you’re used to seeing in the supermarket. This is because humans have been molding the tomato to their own taste for thousands of years, by selecting for larger, tastier and (of course) redder fruits.

As a consequence of this selective breeding, we have significantly altered the tomato genome. A new paper published online this week in Nature Genetics analyzed the genomes of 360 tomato accessions, including multiple wild species and cultivated varieties, to understand exactly how and where humans have left their mark on the tomato genome.

This study, the product of a collaboration between many groups around the world, found that human selection on the tomato has led to vast improvement in certain traits at the cost of dramatically reducing genetic variation in large swaths of the genome. An unintended consequence of historical selective breeding in tomato is that there is now little room for improvement on many traits that we care about. By identifying these regions, the study will allow tomato breeders to make more strategic plans for future crop improvement.

We asked one of the study’s senior authors, Sanwen Huang, to tell us a little more about the work and why it is important:

This study was obviously a huge undertaking. How did collaborations come about, and what were the major difficulties in the project?

As an international consortium, we sequenced the tomato genome together (Nature 2012) and this project was regarded as another milestone of tomato research. The difficulty in the current project was deciding what to sequence. Fortunately, our team includes experts who understand tomato germplasm and they studied the natural variation of tomatoes for a long time. As a corollary, we combined tomato lines from many well studied core collections from several countries, such as the US (Roger Chetelat), Israel (Dani Zamir), France (Mathilde Causse), Italy (Andea Mazzucato), and China (Yongchen Du, Zhibiao Ye, and Jingfu Li).

What do you see as the most important aspect of your study’s results?

There are several important results that came out of this work. First, the evolution of tomato fruit size had two stages, from the wild progenitor of the modern cultivated tomato, Solanum pimpinellifolium, to cherry tomato (from ~1g to ~10g), and from cherry tomato to big-fruited tomato (from ~10g to ~100g). We found that there are two independent sets of QTLs or genes that have been selected during the two evolutionary stages. Second, there is a huge genomic signature of the divergence between fresh tomato and processing tomato [tomatoes used for commercial canning], on chromosome 5. This genomic region harbors several genes related to higher soluble solid content and fruit firmness that were selected during breeding for processing tomato. And more interestingly, we noticed that in recent fresh tomato F1 breeding, this region was also exploited for better taste and longer shelf-life.  Third, we identified the causal variants for the pink tomato, which can be used for selective breeding. Pink tomato is a favorite in North China and I prefer it too, as it tastes better than the red ones. Finally, we found there have been costs to historical selection. For example, the near fixation of 25% of the tomato genome due genetic hitchhiking that occurred during domestication and improvement sweeps, as well as the linkage drags associated with wild introgression.

Cover of Nature, May 2012

Were you at all surprised to find such a large number of domestication and improvement sweeps? Did these results differ at all from other prominent vegetables, such as cucumber or potato?

The number and genomic proportion of domestication sweeps in tomato are similar to those in cucumber. However, the linkage disequilibrium blocks are bigger in tomato than in cucumber, possible due to the fact that tomato is a self-crossing species. Based on our data, we predict that the effective population size of tomato at domestication was about 300, similar to that of cucumber (~500), which is significantly smaller than that of maize (~150,000). This means these two vegetables have undergone much more severe bottlenecks during domestication as compared to maize.

How do you envision tomato breeders using the results of your study?

As a result of this work, tomato breeders will have a panoramic view of tomato variation and a better understanding of the raw materials used in their own breeding programs. From a practical standpoint, they will have access to a database of 11 million SNPs, from which they can pick the ones best suited to their molecular breeding programs. For example, they can combine the SNP dataset with their phenotypic data, to elucidate the genetic bases of important traits. Finally, and importantly I think, they will better understand the limitations of conventional breeding and the cost of historical selection, which will give them clues to improve their future programs.

NRCSHI07018_-_Hawaii_(716072)(NRCS_Photo_Gallery)

{credit}Photo courtesy of USDA Natural Resources Conservation Service{/credit}

Congratulations on your recent move to the Agricultural Genome Institute at Shenzhen where you are a co-founding director. Can you tell us a little about this new institute and what its goals are?

Thanks! The leadership of the Chinese Academy of Agricultural Sciences set up the institute (AGIS) to innovate agricultural research using genomics.

AGIS is located at the Dapeng District of Shenzhen, a beautiful bay area. The Shenzhen municipal government is developing the Dapeng Peninsula as the International Bio-valley and high-tech agriculture is one of the highlights. AGIS will recruit ~200 scientists who will decode, analyze, and utilize agricultural genomes. There will be three themes of research: the first theme is to develop basic algorithms and bioinformatic tools tailored for agricultural genomes, many of which are quite different from the human genome that has been the focus for most bioinformatians; the second theme is to empower agricultural breeding with genomics, to increase the efficiency and effectiveness of breeding that is essential to global food security; and the third theme is to provide genomic surveillance of food safety and agricultural environment, which is a huge concern of society and a need for sustainable development.

A vegetable market in Shanghai, China

A vegetable market in Shanghai, China{credit}nadja robot via Flickr.com{/credit}

Bonus question: What is your favorite vegetable?

China is a country of vegetables, as there are over 200 kinds of vegetables that are regularly consumed in the country. I enjoy the diversity. For fruit vegetables I like tomato, cucumber, and chili; for leaf vegetables, I like Chinese cabbage, lettuce, and coriander.


You can read more about this exciting study at The Scientist. Read the full paper here