Bring on the box plots

Box plots are excellent for visualizing important core statistics of sample data. We hope that a new online plotting tool BoxPlotR will help encourage their wider use in basic biological research.
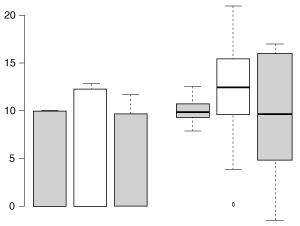
The same three samples plotted by bar chart (left) and box plot (right).

The same three samples plotted by bar chart with s.e.m. error bars (left) and Tukey-style box plot (right). The box plot more clearly represents the underlying data.

A bar chart is often a person’s first choice of plot type when they want to compare values. This is appropriate when the values arise from counting. But when the value is a mean or median of data points taken from a sample, a bar chart is usually inappropriate. As discussed in our March Editorial and the accompanying Points of View and Points of Significance columns, a “mean-and-error” scatter-type plot or a box plot are more appropriate for sampled data. In summary, we strongly recommend that box plots be used when you have at least five data points, but for samples with 3-5 data points mean-and-error plots are more appropriate.

Box plots are heavily used in biomedical research in which statisticians have historically had considerable input into study design and analysis. But although similar types and quantities of sample data also appear in basic research (such as that published in Nature journals) box plots are much less common than bar charts in these manuscripts. Last year in Nature Methods for example, ~80% of sampled data was plotted using bar charts.

Discussions we had with the community suggested that an impediment to using box plots instead of bar charts to graph sample data was due to limited support for box plots in plotting programs commonly used by researchers. It also became apparent that some software that did support the box plot was deficient in communicating to users what the different elements of the plot represented. As a result, strangely labeled box plots were showing up in published papers. At NPG we thought it would be useful to provide authors with a simple online tool they could use to generate basic box plots of their data for publication.

The origin of BoxPlotR
At the VizBi 2013 conference in Cambridge Massachusetts I mentioned NPG’s desire for such a tool at a breakout session chaired by Martin Krzywinski in which the participants, including a young researcher named Jan Wildenhain, discussed what the community needed to create better figures. I also happened to mention our interest in this to Michaela Spitzer while visiting her poster from the Juri Rappsilber and Mike Tyers labs showing how the R-package ‘shiny’ by RStudio can be used to easily convert R code (a popular scripting language for statistics) into a visual application for exploring data.

Later at the conference Jan approached me and said he was intrigued by our desire for someone to design a webtool to create box plots and that he was interested in working on such a project. I happily told him to get in touch with me after the conference so we could discuss it further.

Three weeks after the conference concluded I still hadn’t heard from Jan and was beginning to worry that he had decided not to pursue this. Then… a few days later, I received an email from Jan. Much to my surprise he provided a link to a highly functional tool that he and Michaela, through their own initiative, had gone ahead and created using shiny and R. What followed was a productive and rewarding period of discussion and development during which time Michaela incorporated additional functionality and made selected design changes. The tool appeared so well designed and functional that I encouraged them to submit it to Nature Methods for publication as a Correspondence. After incorporating additional functionality and changes based on comments brought up during peer review BoxplotR was ready for publication.
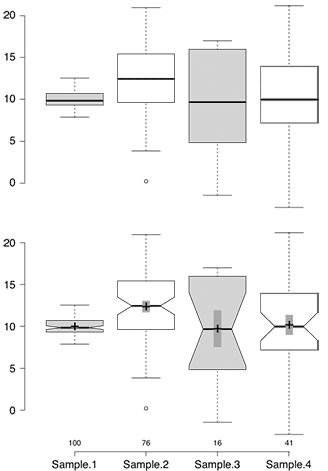
Sample BoxPlotR plots

Sample BoxPlotR plots. Top: Simple Tukey-style box plot. Bottom: Tukey-style box plot with notches, means (crosses), 83% confidence intervals (gray bars; representative of p=0.05 significance) and n values.

Launch of BoxPlotR
To accompany the publication and launch of BoxPlotR we thought it would be useful to provide some information and practical advice about box plots to our readers. Nils Gehlenberg, a former author of several Points of View articles with Bang Wong, agreed to resurrect that popular column for our February issue with an article on bar charts and box plots. Similarly, Martin Krzywinski and Naomi Altman agreed to delay our planned Points of Significance article on the two-sample and paired t-test and instead devote an article to box plots.

Seeing how the community responded to our interest in creating an online box plot tool and then working with them on this project has been a great experience. This never would have been possible without the initiative and talent of Jan and Michaela or the support they received from their PIs Mike and Juri. We hope both our authors and others find BoxPlotR useful and we encourage feedback. General comments can be made here on our blog or by emailing the journal. For specific bug reports and feature requests please see the contact information at https://boxplot.tyerslab.com.

Stephen Quake responds to Lior Pachter

Stephen Quake responds to a blog post by Lior Pachter that analyzes data from his recent analysis of single-cell RNA sequencing methods published in Nature Methods.

In October, we published an Analysis by Quake and colleagues that evaluated a number of single-cell RNA-seq approaches on the basis of their sensitivity, accuracy and reproducibility. In a subsequent blog post, Pachter challenged their data reporting. At issue is whether the failure rate among 96 samples sequenced using the Fluidigm C1 microfluidic instrument should have been presented differently.

We encourage animated discussion of published research and hope that this can serve as a useful forum. In this guest post, Quake responds to Pachter’s blog entry. The views expressed below are solely his and do not necessarily represent those of Nature Methods.

Stephen Quake Methagora blog postIn a recent blog post, Lior Pachter appears to question my scientific integrity and suggest that I unfairly manipulated data in a recent publication on single cell RNAseq.

Pachter has not contacted me directly with his questions nor did he give any warning before publishing his blog post. While I am happy that he is carefully scrutinizing publications and independently re-analyzing primary data, his rather sensationalistic approach to reporting his results in the absence of discussion or peer-review risks doing a disservice to science and adds more heat than light.

Pachter tries to have it both ways – based on our published data he accuses me of 1) wasting effort by sequencing lower quality samples and 2) selectively publishing data from only the better samples. It is hard to see how these accusations can simultaneously both be true. As described in the methods section of our paper, the C1 capture rate is not perfectly efficient and therefore we manually inspected all the chambers. We found 93 chambers had single cells, 1 chamber had two cells, and 2 chambers had no cells. Of the 93 chambers with single cells, 91 of the cells appeared to be alive as measured by a live/dead stain and 2 did not. Our single cell RNAseq experiments included all 91 of the “live” single cells and 1 of the “dead” single cells; the data from the latter was indistinguishable from the former and thus it was included in all further analyses. There was absolutely no selection or manipulation of the data. All of the raw data as well as our R scripts were made available for Pachter and others to download and analyze upon publication of our paper.

The sequencing library prep and workflow that we use is geared around 96 parallel samples and we decided it would be valuable to process control samples in exactly the same batch as the single cell samples. We therefore included four control samples with the single cells: amplification products from a chamber on the chip that did not have a cell (C09, which was unfortunately not given a distinguishing filename during the file upload), a single cell tube amplification, a no template control (NTC, C70) tube experiment that did not have a single cell, and a bulk control sample. Pachter correctly points out that C70 is dominated by the ERCC spike in controls and has essentially no human transcripts as expected; similarly, the other negative control C09 performs very poorly next to the actual single cell data. It is not clear to me why Pachter thinks I should be embarrassed for performing negative control experiments; indeed biochemical amplifiers are known to be so sensitive that there are many stories of contamination that occurs through aerosol dispersal from nearby benches, etc. In our own analyses C09 and the other controls were excluded from the single cell data.

Pachter also noticed that ~ 3 of the single cell RNAseq experiments have significantly lower quality than the other 89, as measured by fraction of spike in sequenced or by log-correlation coefficient. If taken at face value, this corresponds to a failure rate of 3/92, or 3%. The experiments therefore had a 97% success rate by this metric and it is hard to see where his complaint lies. We conservatively included ALL of the single cell data in our analyses and thus if one follows Pachter’s prescription to only analyze the experiments that he deems “successful”, then the results will be even better than we reported.

Finally, Pachter makes a misleading argument concerning the statistical methods used to generate figure 4a. This figure is concerned with the questions of whether an ensemble of single-cell RNAseq experiments produces similar gene expression values as a bulk experiment. The reason for sub-sampling to equal depth is worry of introducing artifacts by comparing two RNAseq experiments of dramatically differing sequencing depth (see e.g. Cai, Guoshuai, et al. “Accuracy of RNA-Seq and its dependence on sequencing depth.” BMC bioinformatics 13.Suppl 13 (2012) and Tarazona, Sonia, et al. “Differential expression in RNAseq: a matter of depth.”Genome research 21.12 (2011): 2213-2223.). This figure has little to do with estimating the quality of the individual RNAseq experiments.

A retraction resulting from cell line contamination

After nine years in print, Nature Methods today published its first retraction; one that could have been prevented by cell line authentication. What does this mean for journal-mandated cell line testing?

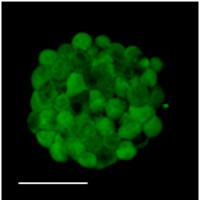
Gliomasphere image

Two-photon fluorescence image of live primary gliomasphere from retracted manuscript.

In a Nature Methods paper published in 2010, Ivan Radovanovic and colleagues described a method to isolate cancer-initiating cells in human glioma without the need for molecular markers. Based on morphology and on a green autofluorescence, the authors reported they could use FACS to sort cancer-initiating cells from gliomasphere cultures (which had been derived from primary tumors). They also detected autofluorescence in cells from fresh glioma specimens, but at a much lower level.

Cells from the autofluorescent fraction could self renew clonogenically in vitro and were tumorigenic when transplanted into mouse brains, the authors reported, and in both cases performed better than non-autofluorescent cells from the rest of the culture or tissue. The origin of this autofluorescent signal was not understood at the time. The authors speculated it may have been related to the unique metabolism of the cancer-initiating cells.

It turns out that most of the primary gliomasphere lines (7 out of 10) were contaminated with HEK cells expressing GFP, leading to retraction of the paper. Using short-tandem-repeat (STR) profiling of two of the lines the authors determined that the contamination occurred over the course of culture in the lab: samples taken from early passages match the original tissue from which the lines were derived, but later passages no longer do so.

It is hardly surprising that the first retraction in Nature Methods is due to cell line contamination, a well acknowledged problem. A 2009 Editorial in Nature pointed to the disturbing results of cell testing by repositories which indicated that 18-36% of cultures were misidentified. It called on repositories to authenticate all of their lines, and for major funders to provide testing support to grantees. At that point funders could require cell line validation for investigators to retain funding, and Nature would require that all immortalized lines used in a paper were verified before publication. Unfortunately, it is now 2013 and we are still far from this goal.

But progress is being made. Community-based efforts are alerting researchers to this problem and providing resources to help them avoid being misled by erroneous results caused by cell line contamination. A 2012 Correspondence in Nature by John R. Masters on behalf of the International Cell Line Authentication Committee (ICLAC) pointed to the following resources available to researchers:

Please go to the ICLAC website for the most recent version of each of these documents.

Meanwhile in early 2013, at the publication end of the process, the Nature journals published coordinated editorials announcing a reproducibility initiative and stating that “…authors will need to […] provide precise characterization of key reagents that may be subject to biological variability, such as cell lines and antibodies.” In practice, the Nature journals are currently requiring all authors to state whether or not testing was done but are only requiring testing in cases where it makes particular sense.

Advocates for mandatory testing have cogent arguments for a uniform mandatory testing policy. First, it would avoid sending a confusing message; second, researchers can’t be certain that cell identity or mycoplasma contamination aren’t affecting results; and finally, continued publication of inaccurate species and tissue designations of misidentified cell lines continues to propagate misinformation.

In the work described in the retracted 2010 manuscript from Radovanovic and colleagues mandatory testing would certainly have been beneficial. However, for probably the majority of work published by Nature Methods there is no question that testing would have no impact on the reported results. For example, in 2011 and 2012 we published at least 17 manuscripts reporting new fluorescence microscopy methods and using imaging data from cell lines to assess the performance of the techniques in measuring fundamental cell properties such as the appearance and width of actin or microtubule filaments, membrane vesicles or other universal cellular structures. Cell line identity and even mycoplasma contamination would not impact the efficacy or conclusions of these measurements. This same situation exists for the validation and testing of many methods in other research disciplines such as proteomics, genomics and biophysics.

Even if these labs should be doing cell validation and mycoplasma testing as a matter of course as part of proper cell culture procedure, mandating that all these studies include such testing as a requirement for publication is unjustified.

But clearly even our most recent efforts at improving compliance with good testing practice will not be sufficient to eliminate cell contamination as a problem in work published in Nature journals. A possible solution may be to require testing by default but authors would be permitted to argue why, in their case, testing is clearly unnecessary. Editors (possibly with reviewer input) would be the final arbiters and would need to ensure that although the lines must be named and sourced, no species or tissue identifiers should be included in the manuscript in the absence of proper validation.

Technology development labs or others that only use cell lines for purposes distinct from biological investigation could continue to avoid testing. But any lab that might potentially use their cell lines to obtain biological results would know that they should institute a proper testing regimen or risk their work not being publishable in a Nature journal.

At this point this is only an idea based on our experience at Nature Methods. We encourage the community to comment and let us know what they think.

Promoting shared hardware design

Now is the time to move open-source hardware development into basic research labs.

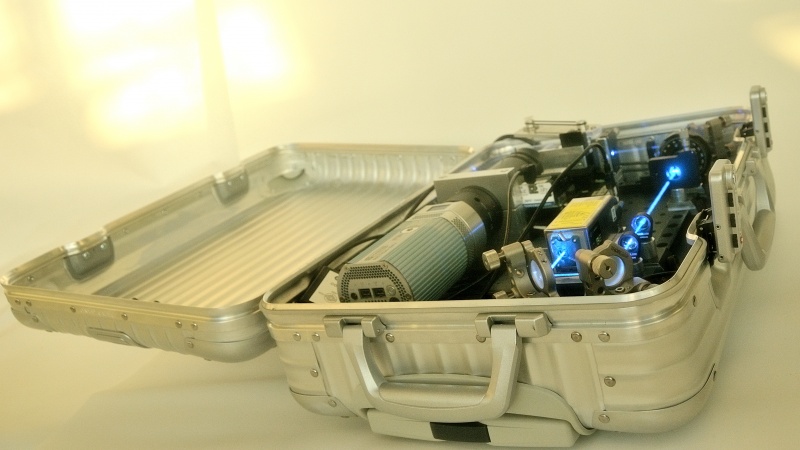
Having convinced airport security to haul a suspicious looking briefcase packed with hardware on board, Pete Pitrone, an imaging specialist in the group of Pavel Tomancak, headed for South Africa. His aim was to introduce young students to the parts, many manufactured at his own institute, in the hope they would assemble them into a sophisticated working microscope. It was a symbolic step to demonstrate the potential for building new tools in laboratories and beyond.

The OpenSPIM microscope-in-a-briefcase.
Credit: Vineeth Surendranath

Manufacturing has gained an appealing image of late. In his State of the Union Address in February, US president Barack Obama announced the creation of three manufacturing hubs modeled after an institute in Youngstown, Ohio. His comments referenced the ability to innovate quickly with additive manufacturing, which relies on digital design and 3D printing: relatively recent improvements which have changed the way that physical objects and devices are made, and helped to open up the design process.

Taking advantage of these developments at the grassroots level is an enthusiastic crop of do-it-yourself ‘builders’ or ‘hackers’ who are promoting a culture of shared design and open innovation, and have spawned a movement towards open-source hardware. Analogous to open-source software, open-source hardware licenses prevent the patenting of hardware designs or physical objects, and require comprehensive and freely accessible design and instructions to allow anyone to build the same device. One working definition and a helpful list of considerations is provided by the Open Source Hardware Association.

The advent of cheap 3D printers such as the RepRap and MakerBot have made it easy, cheap and relatively fast to turn digital designs into objects. 3D printing involves the layered deposition of a heated polymer through a precisely positioned moving extruder. Open-source electronics that can be used to control hardware with software from the likes of Arduino and Raspberry Pi are also making it easier to manufacture sophisticated devices.

In our July editorial, we argue that basic research shares the values of openness and reproducibility embodied by open-source hardware. Beyond making research tools easier and cheaper to build and replicate, developing devices in an open-source environment can actually speed innovation by encouraging community feedback early in development. This can make the work that goes into extensive documentation and robustness testing worthwhile for the individual research group.

Open-source differs from traditional design in its focus:

  • open-source tools are specifically designed for others to build and modify them
  • open-source tools must include extensive documentation, including parts lists, any related software code (also published as open-source) and design files
  • the focus on reproducibility encourages simple, streamlined design
  • modularity and integration are ultimate goals

Many in the design field have said that this focus actually improves designs and promotes the broadest uptake.

Applied technologies like photovoltaics and hardware infrastructure for cloud computing are investing in open-source approaches, but there are currently very few examples of open-source hardware in basic research. OpenPCR publishes the designs for a thermal cycler to conduct PCR, which can be purchased as an inexpensive kit and assembled by hand. Some labs simply use 3D printing to generate teaching models and basic equipment like test tube racks (e.g. the DeRisi lab).

pic2

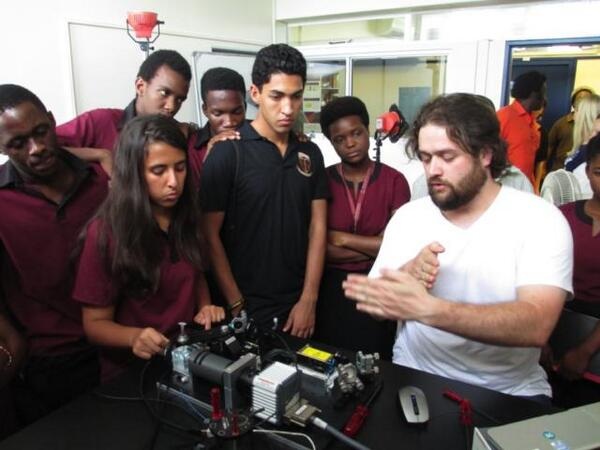
Pitrone teaching South African students how to assemble an OpenSPIM scope.
Credit: P. Tomancak

The July issue of Nature Methods includes two leading examples of academic efforts in this direction, OpenSpim and OpenSpinMicroscopy, that include detailed designs for light-sheet microscopes that can take 3D movies of living things. Parts for the OpenSPIM scope were hiding in the briefcase en route to an EMBO course organized by Musa Mhlanga along with Freddy Frischknecht and Jost Enninga in Pretoria. A highlight according to Pavel Tomancak was to watch talented high school students assemble and successfully operate the scope in under two hours. The availability of design details and the focus on making it possible to build are a model of accessibility that has ramifications in teaching and outreach, encouraging many others to play around with the hardware.

Hardware innovation is a critical part of the technological advances that drive science. To carry out experiments, many research laboratories need tools that are simply not available, cost too much or will take too long to develop commercially. An open-source approach can lower the barriers to adopting, disseminating and ultimately improving tools for research.


An all-encompassing term to describe protein complexity

Neil Kelleher and Lloyd Smith propose that the scientific community adopt the term ‘proteoform’ to refer to all the different forms that a protein can take. Will the community adopt it?

The field of top-down proteomics, in which intact proteins are analyzed by a mass spectrometer, provides rich information about the genetic variations, alternative splicing and post-translational modifications that can be lost in a bottom-up proteomics approach (where proteins are digested into peptides prior to analysis). An unsolved problem in the top-down field, however, has been what exactly to call these various protein forms. Besides ‘protein forms’, a handful of other terms have been batted around in the literature, including ‘protein variants’, ‘protein isoforms’ and ‘protein species.’

In a Correspondence in the March issue of Nature Methods, Neil Kelleher and Lloyd Smith lay out the reasons why none of these terms are satisfactory. What is needed, they argue, is a novel, unique, intuitive, single-word term with a precise definition that is all-encompassing in describing protein complexity, and is also compatible with a gene-centric approach to protein naming. They believe that they have the perfect term: proteoform.

“It’s not just a term, it’s a movement,” says Kelleher. Kelleher has been one of the key drivers of top down methodology development, and argues that using a controlled vocabulary to describe proteins will serve a catalytic role in moving the field forward. “The implicit thing about this term is that it puts a focal point on the fact that [the proteoforms] are the functional players, insofar as protein primary structure is concerned,” he says. Especially in clinical research, he notes, different proteoforms are tied strongly to function and phenotype.

Kelleher and Smith have been gathering support for their term over the last several months by introducing it at conferences and inviting researchers to comment on a LinkedIn forum. The term also has the full support of the Consortium for Top Down Proteomics. At their latest conference in Florida, about a month ago, Kelleher says that “everyone” was using “proteoform” in their talks. “It just catches on…it fills a void the rolls right off the tongue at conferences and sits well in the gut while digesting text,” he says. The consortium website maintains a repository of proteoforms, which they hope will grow. Kelleher also notes that the term is being embraced by key protein informatics players at UniProt and the Protein Information Resource, both of which have adopted a gene-centric approach to protein naming.

What do you think about the term “proteoform”? Will you adopt it? We’d love to hear from you!

Efficiency through analysis

The May Editorial in Nature Methods discusses how the overall efficiency of research can be improved by comparative analysis of research method and tool performance.

Although such analysis studies aren’t considered as ‘sexy’ as basic exploratory research, the benefits for and gratitude from the community can be profound. Large well-funded laboratories are more likely to have the resources to perform such analyses and should not discount the advantages to performing such studies and publishing the results.

Nature Methods has published several such analysis studies in the past. A (probably incomplete) selection is listed below. We will strive to publish even more in the future. Our ‘Analysis’ article type is actually dedicated to these kinds of studies. We encourage communities and labs to both contribute such analyses and suggest methodological areas that would benefit from them. The selection below may provide some inspiration.

2005
Multiple-laboratory comparison of microarray platforms
doi:10.1038/nmeth756
Independence and reproducibility across microarry platforms
doi:10.1038/nmeth757
Comparative evaluation of mass spectrometry platforms used in large-scale proteomics investigations
doi:10.1038/nmeth785

2006
A guide to choosing fluorescent proteins
doi:10.1038/nmeth819

2007
Reproducible isolation of distinct, overlapping segments of the phosphoproteome
doi:10.1038/nmeth1005
Use of simulated data sets to evaluate the fidelity of metagenomic processing methods
doi:10.1038/nmeth1043

2008
Cyclic nucleotide analogs as probes of signaling pathways
doi:10.1038/nmeth0408-277

2009
Cost-effective strategies for completing the interactome
doi:10.1038/nmeth.1283
A HUPO test sample study reveals common problems in mass spectrometry-based proteomics
doi:10.1038/nmeth.1333

2010
Comprehensive comparative analysis of strand-specific RNA sequencing methods
doi:10.1038/nmeth.1491
Microbial community resemblance methods differ in their ability to detect biologically relevant patterns
doi:10.1038/nmeth.1499
Validation of two ribosomal RNA removal methods for microbial metatranscriptomics
doi:10.1038/nmeth.1507

2011
Chemically defined conditions for human iPSC derivation and culture
doi:10.1038/nmeth.1593
Two-photon absorption properties of fluorescent proteins
doi:10.1038/nmeth.1596

Top downloads for August ’09

A paper describing a potential new pipeline for structural genomics based on small angle X-ray scattering was far and away the most popular paper of the August issue. It will be very interesting to see what kind of impact it has on the field. While it may not provide high-resolution structures like x-ray crystalography, it is certainly faster and has a higher success rate, both of which are critical parameters for high-throughput pipelines. A paper from Helicos describing new terminator nucleotides for single-molecule next-generation sequencing (or should this be 2nd or 3rd generation?) made it to the #5 spot.

Top 7 research papers published in the August issue

1. Robust, high-throughput solution structural analyses by small angle X-ray scattering (SAXS)

2. Digital RNA allelotyping reveals tissue-specific and allele-specific gene expression in human

3. Mass spectrometry of membrane transporters reveals subunit stoichiometry and interactions

4. SHOREmap: simultaneous mapping and mutation identification by deep sequencing

5. Virtual terminator nucleotides for next-generation DNA sequencing

6. Global discovery of adaptive mutations

7. Metabolic network analysis integrated with transcript verification for sequenced genomes

The top five spots in the ten most popular papers published prior to our August issue and downloaded during August are unchanged since last month. We have a surprise appearance of an old and slightly controversial paper at position #6. This appearance appears to be the result of their publication of a follow-up paper in PNAS at the beginning of August. Squeaking in at #9 and #10 are two papers from the July issue. The top downloaded paper in July was also close behind but didn’t quite make it.

Top 10 research papers published prior to the August issue

1. Mapping and quantifying mammalian transcriptomes by RNA-Seq

2. mRNA-Seq whole-transcriptome analysis of a single cell

3. Universal sample preparation method for proteome analysis

4. Stem cell transcriptome profiling via massive-scale mRNA sequencing

5. Isolation of human iPS cells using EOS lentiviral vectors to select for pluripotency

6. The development of a bioengineered organ germ method

7. Genome-wide profiles of STAT1 DNA association using chromatin immunoprecipitation and massively parallel sequencing

8. Stable knockdown of microRNA : in vivo: by lentiviral vectors

9. In vivo fluorescence imaging with high-resolution microlenses

10. Mapping the structure and conformational movements of proteins with transition metal ion FRET

Is rare always real?

Deep sequencing of metagenomic datasets by next-generation technology, has revealed a richness and diversity of microbial species that far exceeded previous expectations.

In 2006 Mitchell Sogin presented the concept of a rare biosphere, low-abundance microbial populations that have persisted over large evolutionary time scales. Sogin described it as a ‘potentially inexhaustible reservoir of genomic innovation’ which lets microbial communities recover from environmental assault and allows them to adapt to changed circumstances.

How do scientists determine microbial diversity? Sequence reads covering the hypervariable regions of 16S rRNA genes are often used for classification. These ‘pyrotags’ (named thus since they are obtained on Roche’s 454 sequencer) can be classified by matching them against a rRNA sequence database.

The challenge is that for most microbial species the 16S rRNA gene is not known. An alternative is shotgun sequencing and grouping of reads into operational taxonomic units; i.e. a cluster of sequences with a defined difference to a neighboring cluster — commonly a sequence difference of 3% is required at the species level, 5% at the genus level.

But with predictions of an ever larger rare biosphere voices of caution are starting to be heard saying that its size is overestimated. Is everything that is classified as a new and rare species indeed real, or simply a sequencing error?

Most recently we featured an error correction program in our own pages that addressed this issue; and a note of caution by Phil Hugenholtz and colleagues about ‘Wrinkles in the rare biosphere’ just appeared in “Early View” in Environmental Microbiology.

How well founded are the concerns of an artificially inflated rare biosphere? Are current estimates of the rare biosphere really 10-fold too high? If so, what are the consequences — does it mean that the rare biosphere is far less important than assumed? Is it not such an inexhaustible reservoir after all but just background noise?

We understand that these are very controversial issues and we would love to hear from you.

Top downloads for July ’09

Two Correspondences made the list of top downloads for July coming in at #3 and #4, demonstrating that while this format may not report new methods it does have information of high interest to readers. The two top downloads seem to highlight a high level of interest in assaying single cells and using FRET to examine protein dynamics.

Top 8 research papers published in the July issue

1. Quantitative analysis of gene expression in a single cell by qPCR

2. Mapping the structure and conformational movements of proteins with transition metal ion FRET

3. Limitations and possibilities of small RNA digital gene expression profiling

4. Enabling IMAC purification of low abundance recombinant proteins from E. coli lysates

5. In vivo fluorescence imaging with high-resolution microlenses

6. Protein interaction platforms: visualization of interacting proteins in yeast

7. Agouti C57BL/6N embryonic stem cells for mouse genetic resources

8. Reaching the protein folding speed limit with large, sub-microsecond pressure jumps

There has been very little movement in the ten most popular papers published prior to our July issue and downloaded during July. The exception is the appearance of the HUPO test sample paper from June appearing at #7. The papers below this have changed but mostly because a large number of papers have very similar download numbers and they shuffle around from month to month.

Top 10 research papers published prior to the July issue

1. Mapping and quantifying mammalian transcriptomes by RNA-Seq

2. mRNA-Seq whole-transcriptome analysis of a single cell

3. Universal sample preparation method for proteome analysis

4. Stem cell transcriptome profiling via massive-scale mRNA sequencing

5. Isolation of human iPS cells using EOS lentiviral vectors to select for pluripotency

6. Genome-wide profiles of STAT1 DNA association using chromatin immunoprecipitation and massively parallel sequencing

7. A HUPO test sample study reveals common problems in mass spectrometry–based proteomics

8. Generation of transgene-free induced pluripotent mouse stem cells by the piggyBac transposon

9. Amplification-free Illumina sequencing-library preparation facilitates improved mapping and assembly of (G+C)-biased genomes

10. A versatile tool for conditional gene expression and knockdown

Top downloads for June ’09

Here are the top downloads for June. Due to lack of time I have to forego any comments this month but I’ve posted the rankings of the five most popular papers published in our June issue based on PDF downloads during June.

Top 5 research papers published in the June issue

1. Predicting microRNA targets and functions: traps for the unwary

2. Automated unrestricted multigene recombineering for multiprotein complex production

3. A HUPO test sample study reveals common problems in mass spectrometry–based proteomics

4. Versatile P[acman] BAC libraries for transgenesis studies in Drosophila melanogaster

5. High-throughput ethomics in large groups of Drosophila

There has been quite a reshuffling of the ten most popular papers published prior to our June issue and downloaded during June. Part of this movement may be due to the fact that beginning this month I have decided to use the number of successfully downloaded PDFs rather than combined PDF and HTML views but I think most of the explanation is the high quality of the papers published in our May issue which have displaced some of the older papers.

Top 10 research papers published prior to the June issue

1. Mapping and quantifying mammalian transcriptomes by RNA-Seq

2. mRNA-Seq whole-transcriptome analysis of a single cell

3. Universal sample preparation method for proteome analysis

4. Isolation of human iPS cells using EOS lentiviral vectors to select for pluripotency

5. Super-resolution video microscopy of live cells by structured illumination

6. Generation of transgene-free induced pluripotent mouse stem cells by the piggyBac transposon

7. Stem cell transcriptome profiling via massive-scale mRNA sequencing

8. Genetically encoded fluorescent indicator for intracellular hydrogen peroxide

9. Genome-wide profiles of STAT1 DNA association using chromatin immunoprecipitation and massively parallel sequencing

10. Enzymatic assembly of DNA molecules up to several hundred kilobases