Methylation marks tumor suppressors

Sharp and broad H3K4me3 peak definitions

Sharp and broad H3K4me3 peak definitions{credit}Chen et al. Nat. Genet. 2015{/credit}

Modifications to histones, including methylation and acetylation, are used by cells to regulate gene expression. Though a lot is now known about how different histone marks correlate with transcriptional activation or repression, the “histone code” has not yet been fully elucidated. As we discussed last week, a recent study found that, contrary to expectation, genes that are dynamically regulated during development do not display histone modifications normally associated with active transcription.

A new study published this week in Nature Genetics reports another unexpected epigenetic pattern. Tri-methylation of histone 3 at lysine 4 (H3K4me3), a mark associated with active transcription, is usually present as a sharp, narrow peak at the gene promoter. The authors of the study observed that some genes show a different pattern of H3K4me3: broad, low density methylation spanning up to 10kb along the gene body.

The broad H3K4me3 mark was associated with high gene expression levels and transcriptional stability in this study. The authors also found that cell identity genes and, interestingly, tumor suppressor genes, were enriched for the broad H3K4me3 mark.

broadpeaks_genes

H3K4me3 density at housekeeping genes and tumor suppressor genes. Right panel is a zoomed-in version of the left panel.  {credit}Chen et al. Nat. Genet. 2015{/credit}

Though it is unclear why tumor suppressors specifically would be associated with this mark, a comparison between normal and tumor cells showed that H3K4me3 peaks at tumor suppressor genes became narrower in cancer cells and that this was associated with transcriptional repression. Finally, the authors showed that candidate tumor suppressor genes could be identified by the broad H3K4me3 mark.

We asked one of the study’s lead authors, Wei Li, to tell us a little more about the study:

What was the motivation for your studies?

The general motivation was to make novel discoveries based on existing ‘big data’ in epigenomics. In order to do so, we have had to develop novel bioinformatic tools that will enable us to look at the data from a completely different angle.  In particular in this study, we developed a new tool to quantify the H3K4me3 signal based on its width only. Most previous studies have only focused on its height or total signal, because the majority of genes (>95%) only have narrow (<1 kb) and high H3K4me3 peaks.   This simple method has never been used in epigenomic data analysis before. We further proved that this computer-derived broad H3K4me3 signal alone is sufficient to define both known and novel tumor suppressors and its performance is even better than the human curated KEGG pathway in cancer (a collection of well-curated signaling networks involved in cancer development).

When you first observed broad H3K4me3 peaks, did you expect that it would be such a widespread feature of tumor suppressor genes?

No, it is totally unexpected. Many people in the field (including ourselves) observed broad H3K4me3 peaks long time ago (even in the first histone mark ChIP-seq paper published in 2007), but all ignored them and treated them as potential sequencing artifacts.  My lab used the UCSC genome browser to check epigenetic patterns gene by gene on a daily basis, and we gradually noticed that broad H3K4me3 peaks are consistently observed in different datasets and specific to a small group of genes. To test whether it is an artifact or not, we decided to perform a functional enrichment analysis of genes marked with broad H3K4me3. If nothing is enriched, it must be a sequencing artifact.  Interestingly, we found an unexpectedly strong enrichment in tumor suppressor genes.

Did you consider whether any other classes of genes were enriched in this histone mark?

We used an unbiased data-driven approach (rather than hypothesis driven) to study the genes marked with broad H3K4me3 peaks. It turns out that only cell identity genes and tumor suppressors are enriched. When we removed cell-type specific broad H3K4me3 peaks by epigenomic conservation analysis, tumor suppressors is the only class of genes that are enriched in the conserved broad H3K4me3.

Widespread shortening of H3K4me3 peaks in cancer

Widespread shortening of H3K4me3 peaks in cancer{credit}Chen et al. Nat. Genet. 2015{/credit}

Tumor suppressors are defined by their role in cancer. Why do you think they show a similar pattern of H3K4me3 in normal cells?

A common feature of tumor suppressors is that they are usually highly expressed in normal cells to prevent tumor formation. This is likely why they show a similar pattern of H3K4me3 because broad H3K4me3 is associated with increased transcription elongation and enhancer activity together leading to exceptionally high gene expression in normal cells.

Not all tumor suppressors show the broad H3K4me3 mark. Why do you think this is?

Cancer is always heterogeneous. To my knowledge, there is no single mechanism in the literature that can specifically explain all tumor suppressors. Broad H3K4med3 is not an exception.

 

Developmentally regulated genes break the rules

A new study published online this week in Nature Genetics reports that a certain class of genes, those with expression restricted to a specific developmental time point, follow a different set of rules than the rest of the genome.

The modifications to histones in promoter and enhancer regions are generally predictive of gene expression. For example, when a promoter is highly methylated at lysine 4 on histone H3 (H3K4me3), its associated gene is generally highly transcribed. Other marks may also be associated with activation, while different marks are associated with gene repression.

Developmentally regulated genes show similar H3K4me3 levels to silent genes, even though they are highly expressed during development.

Developmentally regulated genes show similar H3K4me3 levels to silent genes, even though they are highly expressed during development.{credit}Pérez-Lluch et al. Nat. Genet. doi: 10.1038/ng.3381{/credit}

SÍlvia Pérez-Lluch et al. examined the expression levels and histone modifications for all genes in the Drosophila modENCODE data set and identified a surprising pattern. Genes that were restricted in their expression to a specific developmental timepoint (called “developmentally regulated genes”) lacked epigenetic marks of active transcription, even when they were highly expressed. The authors confirmed the same pattern using modENCODE data for the netmatode C. elegans. 

Developmentally regulated genes  showed  expression levels during their actively transcribed period that were similar to those of  genes that are expressed stably throughout development. Another pattern identified by the authors was that strong histone marking is also associated with transcriptional stability. Comparable expression and chromatin modification data to that of the fly and worm aren’t yet available for mammals across multiple developmental timepoints. However, using data from ENCODE, the authors were able to show that mammalian cells showed a similar trend with regards to transcriptional stability.

We asked the lead authors of the study,  SÍlvia Pérez-Lluch, Montserrat Corominas and Roderic Guigo to give us a little insight into the history of this study and where they see this research going in the future:

When you began this study, what were your expectations? Did you expect to find that active chromatin marks were missing from so many actively transcribed genes?

We did not. Actually, our initial aim was not to investigate the relationship between chromatin marking and transcription, but the role of histone modifications in the regulation of splicing. We designed our initial experiments to compare levels of histone modifications in exons that were differentially included between Eye-antenna and Wing imaginal discs (EID and WID)—our hypothesis at that time being that the levels of some histone modifications would correlate with differential exon inclusion between these two tissues. But the results were quite frustrating, since we did find, in general, very low levels of marking in exons that were differentially included between WID and EID. This was initially very disappointing to us.  However, we also found, more generally, that many genes that were differentially expressed between WID and EID had also very low levels of a number of histone modifications typically associated to active transcription—even genes with very high expression levels. Since many such genes are likely to be regulated during development, this led us to hypothesize that lack of active histone modifications could be a general feature of developmentally regulated genes. This seemed an implausible hypothesis, going against the current models of the relationship between chromatin marking and transcription. Nevertheless, we turned to modENCODE data to further test it. The results were so strikingly consistent with our model that we “forgot” about our initial aim, and we focused our efforts instead into gathering additional supporting evidence. Understandably, our results were initially met with skepticism—the concern being that lack of chromatin marking could be a technical artifact derived from developmentally regulated genes having restricted expression patterns, and therefore making histone modifications difficult to detect using current technologies. Thus, a substantial amount of our work has been directed to address this concern.

Why do you think this pattern had not been observed before?

We are actually not the first to observe transcription with apparent lack of histone modifications. There have been a few reports of genes being transcribed in the absence of some histone modifications. Our main contribution is to show that this phenomenon is more widespread that generally assumed, and that it characterizes specifically genes that are regulated during development (at least in fly and worm). Why has this not been observed before? Mostly because data containing estimates of gene expression and histone modification along a sufficiently large number of developmental time points were not available before the modENCODE project. Then, we used a very simple, but effective measure to identify genes regulated during development, the coefficient of variation of gene expression. In summary, to make this observation you need both the data and the right approach to look at it

Your study showed that the link with transcriptional stability is also present in mammalian cells. If the association between chromatin marks and developmental regulation also holds in mammals, what, if any, do you think are the implications for biomedical research?

This is difficult to answer. Our initial results suggest that the model could be also applicable to mammals, but the data to test it are not yet available. Here we need to emphasize the importance of well-designed large-scale data production projects that monitor genome activity (transcription, chromatin structure, 3-dimensional genome organization, transcription factor binding, etc.) in a systematic and consistent way. We also want to emphasize that, at this point, our research is very basic. However, one could speculate that if our model holds in mammals, it could contribute to design better-informed approaches to manipulate/modulate expression levels of genes. Extrapolated to mammals, our results suggest that transcription factors play a comparatively more important role than histone modifications in the regulation of tissue specific genes. It has been shown that, in humans, tissue specific genes are more likely to be involved in diseases.

Are you able to speculate as to why developmentally regulated genes use a different epigenetic program compared to other genes?

What we call developmentally regulated genes correspond to genes with variable expression along time, which are often expressed only at a particular time point. Since development is a continuous process, one could speculate that rapid activation and de-activation of genes that are specific to a particular time point is more likely to occur without the need of modifying histone residues in chromatin.

What do you see as the most important next steps in this area?

Maybe the most important issue is to further challenge the model by investigating additional systems—in particular, mammalian systems—including differentiation processes, and additional histone modifications. The ultimate test of the model would come, however, from single-cell analysis, that is, from monitoring whether gene transcription does occur without histone modifications within the same cell. This is currently not possible given available technologies, but it may be feasible in the near future. It would be also important to investigate the role of distal enhancers, and of 3D chromatin structure, in the expression of developmentally regulated genes. Furthermore, we need to dig into the mechanism, by analyzing, for instance, how different classes of genes respond to perturbations of histone modification systems.


APOBEC3A takes the lead

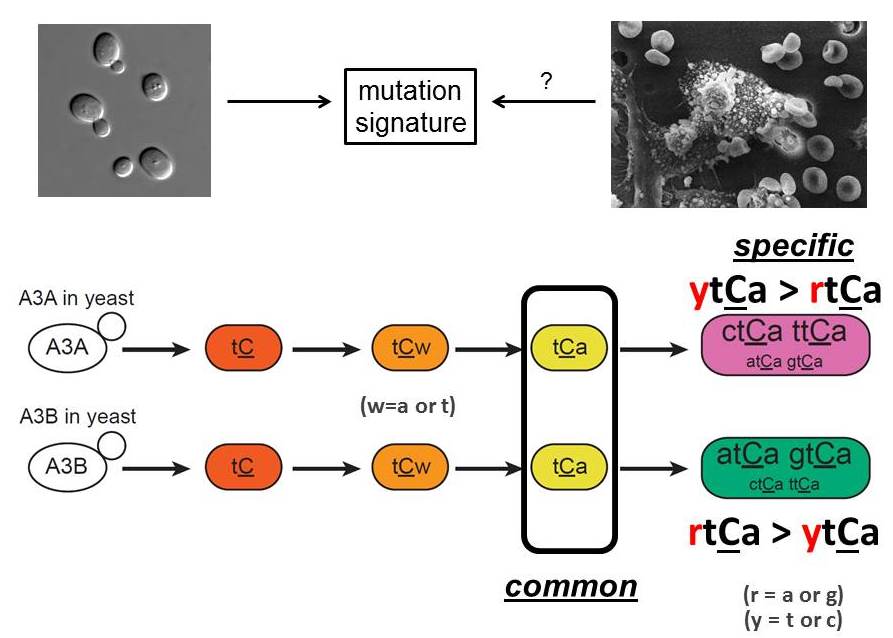
A3A and A3B mutagenesis signatures

A3A and A3B mutagenesis signatures{credit}Dmitry Gordenin{/credit}

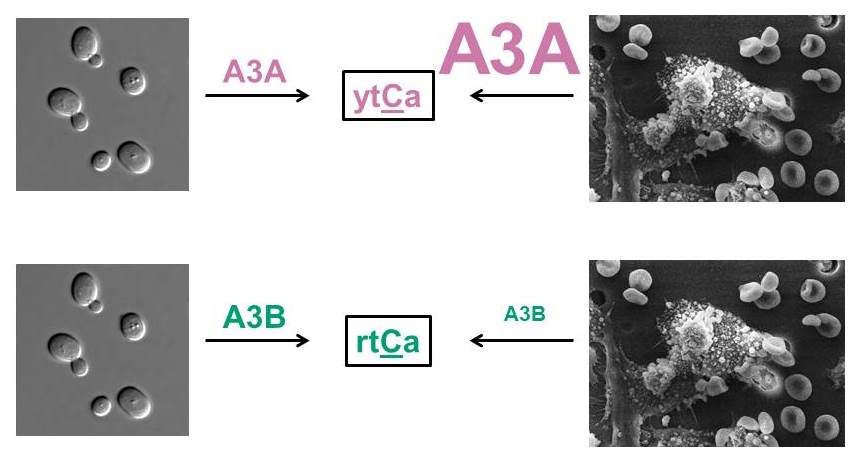
A paper published online today in Nature Genetics reports that the DNA-specific cytidine deaminase APOBEC3A (or A3A) is likely to be the major driver of APOBEC-mediated mutagenesis in human cancer. This finding is somewhat surprising because another deaminase, APOBECA3B (or A3B), has been considered the more likely mutator based on previous studies. Gene expression levels of APOBEC3B as well as mutagenic signatures in certain cancer types, such as breast cancer, have been consistent with a primary role for A3B in cancer-related mutagenesis. However, results of a recent paper by Serena Nik-Zainal et al. called this into question by showing that breast cancer samples from individuals with germline APOBEC3B deletions showed high levels of mutations consistent with APOBEC-dependent mutagensis.

Now, Dmitry Gordenin and colleagues expressed either A3A or A3B in a yeast reporter strain that allowed them to collect large numbers of mutations induced by these enzymes. Mutations were identified using whole genome sequencing and compared between the two enzymes. They were able to demonstrate that A3A and A3B induce mutations at specific genomic sequence motifs that could be reliably differentiated. Surprisingly, A3A tended to induce many more mutations than A3B, approximately 10-fold more. With the mutagenic signatures of the two enzymes at hand, they were able to show that A3A contributes to APOBEC-dependent mutagenesis in human cancers and may in fact be the primary driver of these mutations.

Click the link below for a video summary of the paper (created in collaboration with the authors):

An APOBEC3A hypermutation signature is distinguishable from the signature of background mutagenesis by APOBEC3B in human cancers from Research Square on Vimeo.

We asked two authors of the paper, Kin Chan and Dmitry Gordenin, to give us a little more background about this exciting new research:

Given that APOBEC3A is expressed at relatively low levels in cancer samples (compared to APOBEC3B), what motivated you to study the potential role of APOBEC3A in cancer rather than any of the other APOBECs?

From the very beginning, we did not have very much hope that the level of mRNA in tumors at the time of surgical excision would correlate strongly with the detected number of mutations induced by APOBECs in these tumors, because mutations detectable by sequencing would have formed much earlier.  We showed that mutation load was only weakly correlated with transcript abundances of both APOBEC3A and APOBEC3B.  In fact, we did not particularly favor the APOBEC3A versus APOBEC3B dichotomy model with respect to the identity of the major mutator in cancers when we started our yeast experiments.  We just wanted to get more precise estimates of their signatures in our yeast system, which was designed to enrich for accumulation of multiple APOBEC-induced mutation clusters as well as detecting scattered mutations.
Why do you think the distinct signature of APOBEC3A was not identified in previous studies, for example the study by Taylor et al.?

Yeast system reporting mutagenesis in ssDNA identifiedcommon and specific  components of A3A and A3B mutation signatures

Yeast system reporting mutagenesis in ssDNA identified common and specific components of A3A and A3B mutation signatures
{credit}Dmitry Gordenin{/credit}

In fact, Taylor et al. did notice differences between mutation signatures of single-strand (ss) DNA-specific APOBEC3A and APOBEC3B cytidine deaminases separately expressed in yeast.  However, they had significantly fewer mutations caused by APOBEC3A, which is less of a mutator as compared to APOBEC3B in the proliferating yeast used in that study. Our yeast system was devised to enable the facile study of mutations induced by APOBECs in stretches of ssDNA formed during growth of yeast cultures, along with mutations caused in long persistent stretches of subtelomeric ssDNA formed in response to regulated telomere uncapping.  The latter form of ssDNA is hypermutable by APOBECs, which results in formation of mutation clusters (also called kataegis by other groups) that are so characteristic of hypermutation caused by APOBECs in human cancers.  It is worth noting that Taylor et al. noticed that some samples of breast cancer had mutation spectra resembling that induced by APOBEC3A, while other spectra were more similar to APOBEC3B’s.  However, the statistical approach they used did not provide sufficient power to highlight individual samples with statistically significant enrichment for certain mutation signatures.

A significant factor to our success was the use of an analytical design described in our previous papers (Roberts et al. 2012 and Roberts et al. 2013).  The essential idea of this design is that it uses all available mechanistic knowledge emerging from our yeast experiments and from studies of other labs to formulate a stringent statistical hypothesis, which is then used to interrogate cancer datasets.  This approach allowed us to compute robust sample-specific p-values even for exome mutation catalogues, which contain around 1% of mutation numbers characteristic of the whole genome mutation load.

Were you surprised by the result that APOBEC3A may be responsible for ten times more mutations in cancer than APOBEC3B?

We certainly were, because when we made this discovery we were thinking that APOBEC3B was more likely to be the major mutator in cancers.  But upon re-reading the literature, the finding that APOBEC3A is actually the culprit makes sense:  Three groups had independently shown that ectopic overexpression of APOBEC3A causes many DNA breaks while similar overexpression of APOBEC3B made much, much fewer breaks.  We think that an important reason for APOBEC3A’s mutagenic prevalence in cancers is that some of these breaks are repaired by mechanisms generating long ssDNA intermediates—in other words, APOBEC3A substrates.  This would also be consistent with previous observations that APOBEC-signature mutation clusters frequently co-localized with chromosomal rearrangement breakpoints in cancers.

What are your biggest unanswered questions related to this study?

It is clearly the question about what molecular mechanisms underlie this strong bias towards APOBEC3A in cancer hypermutation.  However, this may require years of studies by many excellent labs that have already developed and continue to productively explore this field. Our work not only highlighted the strong influence of APOBEC3A in cancer mutagenesis, but also confirmed that APOBEC3B makes its own contribution, perhaps in even more cancers than APOBEC3A.  We are interested to explore new larger data sets of cancer mutations becoming available through the recently announced Pan-cancer Analysis of Whole Genomes  project to elucidate the roles of these APOBECs in different cancer types, stages of cancer development and regions of cancer genomes.

 How do you see others using these results, either in research or in the clinic?

We hope very much that our findings will stimulate development of new assays to measure protein levels of individual APOBECs in cancers, which may turn out to be a better predictor of hypermutation and of clinically important tumor features.  APOBEC3A- and APOBEC3B-specific antibodies required for such assays are still to be developed.  Another important area is biochemical studies of both enzymes, which may clarify why one of them can cause DNA breakage, while the other does so only inefficiently.  It will also be interesting to identify the interacting proteins that keep APOBEC3A in the cytosol of healthy cells, as this could lead directly to the reasons for APOBEC3A essentially going rogue and entering the nucleus to hypermutate genomic DNA in cancers.

As for clinical applications, determining the APOBEC mutagenesis signature of a tumor could inform decision making on personalized medicine:  a tumor where APOBEC3A is actively causing hypermutation might have to be treated very differently from a tumor where there is only APOBEC3B background levels of mutagenesis.  Screening for APOBEC signature mutagenesis in cell-free DNA for individuals at high risk (for example, patients with germline deletion of APOBEC3B) might be a useful early warning diagnostic in the near future.  Also, it’s straightforward to propose that a specific APOBEC3A inhibitor might be of value for personalized medicine, more so than a broad-spectrum APOBEC inhibitor, which would likely severely compromise innate immune function. In a more speculative sense, the idea of overexpressing an APOBEC in order to kill cancer by hypermutation catastrophe has been around for a while in the field.  The latest news in cancer research is that some hypermutated cancers are more susceptible to immune treatment than tumors with lower mutation loads.  The suggested explanation is in the creation of neo-antigens that trigger immune attack on the tumor.  Interestingly, therapeutic overexpression of APOBEC3A might combine this hypermutation effect with DNA breakage – a feature of several established cancer drugs.