From the archives (2004): Large-scale structural variation in the human genome

Scherer_Lee

{credit}Iafrate et al. Nature Genetics 2004{/credit}

During the past 25 years, Nature Genetics has been lucky to publish many exciting papers, more than a few of which can be described as “landmark” papers—publications that have had a dramatic and long-lasting impact on a field. In 2004, the Journal published such a study by Stephen Scherer, Charles Lee and colleagues (Iafrate et al.) in which they reported 255 loci across the human genome containing large structural variants.

In 2017, the idea that there exist large numbers of structural variants in the genome (such as rearrangements, deletions and insertions) that differ from person to person is an established fact. But in 2004, this was not the prevailing wisdom. Prof. Scherer has already written an excellent essay at The Winnower about the study and its importance to the field, so I won’t recap it in detail here—I will simply encourage you to the read the piece.

Charles Lee wrote us about the study by email. “I saw a talk by Dr. Dan Pinkel at the 2002 ASHG meeting where he presented his latest array CGH findings,” he remembers. “In his talk, one of the slides showed the array CGH results of a trisomy 18 patient and Dan remarked how cleanly his array platform performed, especially for the other chromosomes. But in fact, I (and others, I’m sure) could see that there were actually occasional clones that deviated from the expected log2 ratio of 0. During the question period, I sheepishly asked him about these clones. I really didn’t mean to criticize his platform, but I think that he took it that way. Those “blips” bothered me and when I returned to Boston, John Iafrate (who was a postdoc with me at the time) began our own array CGH experiments. Ironically, there were several other groups that were way ahead of us with respect to technical expertise and experience with array CGH, but it could be that they considered these “blips” as technical artifacts – without biological implications.”

Prof. Lee added, “In late 2003, I gave a talk at the University of Toronto and met Stephen Scherer in person for the first time. In a casual conversation, we realized that we were both using the same 1 MB chromosome microarray platform from Spectral Genomics and that we were both seeing these recurrent ‘blips’ in our data.”

Stephen Scherer also corresponded with us by email about the study and the mutual decision to collaborate with the Lee lab. “We were both were fresh enough to look beyond what others were calling ‘noise’ to realize these aberrations represented intermediate and gene-level copy number variation.”

“Many of us suspected it was there,” he said of the large-scale variation they uncovered, “based on the fact there were lots of smaller indels and that 0.6% of the population carried cytogenetic alterations. We kind of predicted it in our chromosome 7 mapping and sequence paper, but only at the chromosomal level.”
ng1416-F1

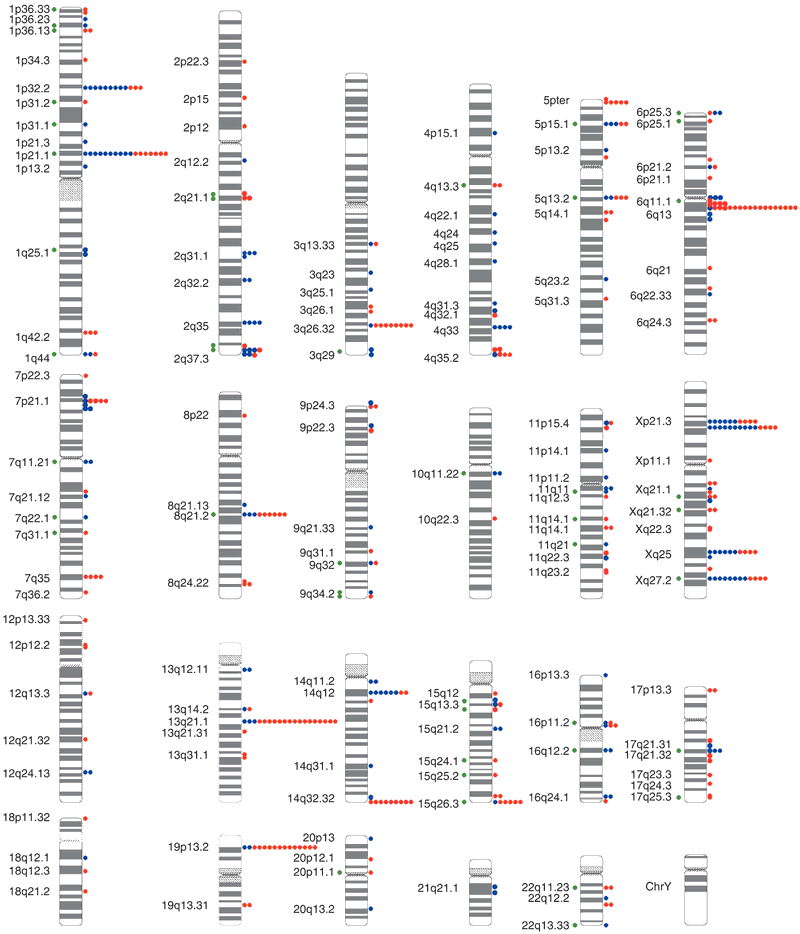
Circles to the right of each chromosome ideogram show the number of individuals with copy gains (blue) and losses (red) for each clone among 39 unrelated, healthy control individuals. Green circles to the left indicate known genome sequence gaps within 100 kb of the clone, or segmental duplications known to overlap the clone, as compared to the Human Recent Segmental Duplication Browser. Cytogenetic band positions are shown to the left. {credit}Fig. 1 from Iafrate et al. 2004{/credit}

The study by Iafrate et al. was published on August 1, 2004. Exactly one week prior, a very similar study by Michael Wigler and colleagues (Sebat et al.) was published in Science. The methods used by the two groups were different, but the findings and implications were consistent with each other. “Charles and I were happy to see the Wigler paper,” said Prof. Scherer, “because nobody believed our results.” Prof. Lee added, “This was one of the most difficult papers for me to publish. The reviewers were very skeptical. We had to keep providing more and more validation data, and one of the reviewers even commented that s/he did not believe that the paper was worthy of being an article and we had to shortened the paper into a Brief Communication. At the end, Reviewer #2, who was persistently negative wrote: ‘… I still feel hesitant about publication of this work in Nature Genetics… and I still doubt the importance and novelty of their work.” Prof. Scherer remembers similar levels of skepticism in the community. “Prior to publication I was showing the data at talks, including one at Michigan where they were trying to recruit me, and I remember getting trashed. People in my own department were mostly the same.”

[I looked up the referee reports and internal notes from the review process and Prof. Lee is correct that at least one of the reviewers was very skeptical about the impact of the study. However, I do want to note the very unusual fact, at least by today’s standards, that the study was published a little more than 2 months after initial submission, according to our records. I wish this was more common!]

After publication, however, the importance of the studies was immediately clear, at least to those working most closely in the field. Nigel Carter contributed a News and Views article in Nature Genetics about the studies. He wrote, “This unexpected level of LCV [large-scale copy-number variation] forces us to re-evaluate our view of the structure of the normal human genome.”

However, Prof. Lee remembers some ongoing skepticism about the work. “For more than 18 months after the paper was published, I had trouble getting grant funding for continuing my work in human copy number variation. Some comments that I received included, ‘If this was real, the Human Genome Project would have found it.’ I am embarrassed to say that I was forced to write for smaller grants on other topics and when funded, did everything I could to complete the projects using less money and use the ‘extra’ funds for my human copy number variation interests. It was very, very frustrating.”

In 2007, Science announced Human Genetic Variation as the Breakthrough of the Year.  “When I saw this article in Science,” Prof. Lee said, “I felt like there was finally some widespread acceptance of our findings in the general scientific community.”

“However, this came with different issues.” For example, he often received the response from the GWAS community that structural variation is interesting, but it is too difficult to incorporate into GWAS. “So, most association studies continued to focus on SNPs, which is a problem that persists to this very day.”

The findings in Iafrate et al. were based on, by today’s standards, a fairly small sample of 55 individuals profiled by array comparative hybridization array comprising ~12% of the genome (the study in Science reported results from 20 individuals using representational oligonucleotide microarray analysis). However, the impact on the field was anything but small. Part of the legacy of the studies was the establishment of the Database of Genomic Variants (originally the Genome Variation Database) that has now collected over 550,000 CNVs. The discovery that so many structural variants are present in our genomes, even in healthy individuals, opened up an entire field of study to understand the function of these variants, and much is still to be discovered (see for example a recent study on the impact of structural variation on human gene expression).

Prof. Scherer summed up the impact of the studies this way: “If you remember the fights between the public Human Genome Project and Celera Genomics, and them finger-pointing to the errors in each other’s assemblies, in many cases these were due to CNV and other structural variations. They had no idea these CNV variants existed. It was really the 2004 Nature Genetics and Science papers, coincident, pure discovery, that opened the eyes of the community and it took some longer than others to believe it.”

From the archives (1995): Guidelines for interpreting and reporting linkage results

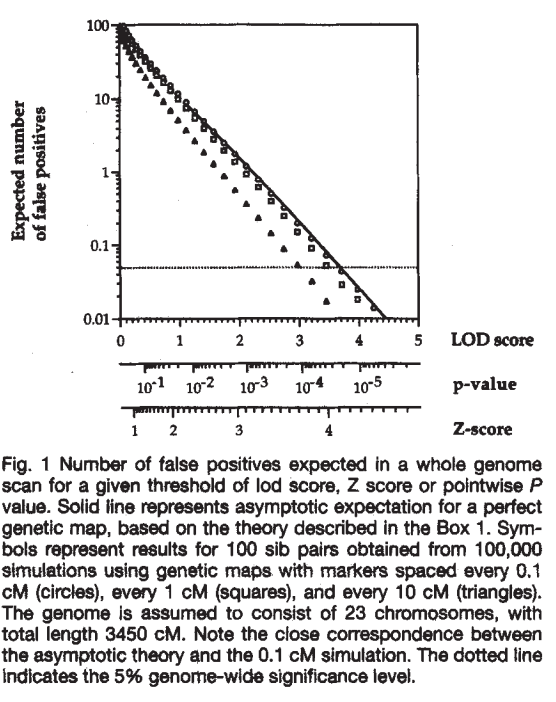
NG1995In 1995, Nature Genetics published a report by Eric Lander and Leonid Kruglyak, recommending clear statistical guidelines for reporting linkage results for complex traits. The paper had an immediate impact, setting the bar for what could or could not be called “significant” in the literature. Although originally focused on human genetic linkage studies, the guidelines set forth by Lander & Kruglyak influenced fields from model organism genetics to plant genetics, and eventually genome-wide association studies (GWAS).

The mid-1990’s was a very exciting time in genetics. The human genome project had recently been announced and advances like microsatellite linkage maps of the human genome and multiplex sequencing technology were now available. Mapping genes underlying complex phenotypes was now a real possibility, and human geneticists were busy prospecting for genetic gold. However, as Lander & Kruglyak cautioned in their paper, the lack of clear guidelines could foster a spate a false positive reports that would, if left unchecked, discredit a the nascent field (for example, see this 1993 paper in Nature Genetics finding no evidence for a previously-reported linkage region for manic depressive illness).

On the other hand, setting too high a bar for reporting significance would mean missing many true signals where they exist, an equally dangerous proposition for a new field. As explained in the paper, “striking the right balance requires both a mathematical understanding of how positive results will occur just by chance and a value judgment about the relative costs of false positives and false negatives.” The paper then outlines the mathematical and statistical arguments in favor of the standards we now all know and love.

Capture

{credit}Lander & Kruglyak, Nature Genetics 1995{/credit}

I spoke with Leonid Kruglyak, co-author of this landmark paper, to get a sense of the context in which this paper came about, and the impact it had on the field at the time of publication. He first explained that it was finally possible to conduct genome-wide linkage studies with hundreds of individuals, allowing linkage mapping methods to be applied to complex traits (for example, this genome-wide screen for schizophrenia susceptibility genes published in the same issue). However, unlike Mendelian genes, there was no clue as to “how many signals there should be, or what their expected sizes were.” Thus, the need for a statistical framework.

This need was recognized as well by the Journal. As Prof Kruglyak recalls, Kevin Davies (founding editor of Nature Genetics) originally commissioned this work as a News & Views article, but it then evolved into a more extensive piece as its implications became clear. However, as he remembers, there was still a very strict deadline for the paper as it had to make the next issue (and these were still the days of hard-copy submissions). At the time, Prof Kruglyak was a young postdoc, so it fell to him to rush to the main FedEx office in downtown Boston before closing time, to make sure the manuscript got to the printer on time.

Prior to submitting the final text, Lander & Kruglyak produced some of the “original preprints”, sending a copy of the paper by snail mail or email to “everyone we knew in statistical genetics”, for comments and suggestions. After all, these guidelines would affect quite a lot of people and “signals that people would like to be results might not be real results anymore”.

Presentation1

{credit}Curtis, Nature Genetics 1996{/credit}

Following publication, “the reactions came in essentially two flavors,” Prof Kruglyak recalls. There were those who thanked the authors, saying that someone really needed to do this. Others were less enthused. “They said, ‘you’re standing in the way of progress and making it harder to publish.’” In fact, Nature Genetics published two letters to the editor arguing that the proposed genome-wide significance threshold was too strict, or that at the very least additional discussion was warranted before these guidelines were adopted (see the letters here and here, and the authors’ reply here). Personally, I agree with the overall sentiment of Lander & Kruglyak as summed up in this portion of their reply: “The correspondents (all trained statisticians) argue that there is no need for guidelines because everyone should be able to interpret the genomewide significance of pointwise P values on their own. In our view, this is naïve. Most geneticists are not statisticians, and rules of thumb can be extremely helpful in promoting sensible discussion.”

The legacy of this paper is clear to anyone familiar with GWAS. “The GWAS community learned a lot from that whole experience [of false positive linkage reports],” says Prof Kruglyak. “There were many serious statistical geneticists involved [in the GWAS field] from the beginning, with a lot of carryover from the linkage era to the GWAS era.”

“Guidelines are not just ‘external gatekeepers’”, he noted.  They are not just there to tell you what you can and can’t publish. “You know what they say, the easiest person to fool is yourself.” These guidelines were developed to help researchers understand their own findings better and decide which are worth following up. “You can often make up a plausible story, but how strong is the evidence?”

Mutation rates of Mycobacterium tuberculosis: From the archives (2013)

Mycobacterium tuberculosis- credit: NIH-NIAID (CC-BY)

Mycobacterium tuberculosis- credit: NIH-NIAID (CC-BY)

Continuing with our month-long celebration of Nature Genetics 25th anniversary, I have chosen to highlight a study by Sarah Fortune and colleagues estimating mutation rate differences between different lineages of Mycobacterium tuberculosis published in June 2013.

Multidrug resistance in M. tuberculosis is a global problem, and understanding the origins and dynamics of the emergence of resistance is an important scientific and public health endeavor.

Building on their previous work that used whole genome sequencing to estimate mutation rates of M. tuberculosis during latent infection, the authors then went on to study the rate at which different strains acquire drug resistance mutations. Using classical fluctuation tests and measuring rifampicin resistance in both clinical and laboratory isolates, they determined the mutation rates for strains from lineage 2 and lineage 4, observing an order of magnitude difference between them, with lineage 2 having the higher rate. These lineage 2 strains also acquired resistance to other antibiotics (ethambutol, isoniazid) at a higher rate than lineage 4 strains.

The authors then sought to relate the in vitro data to the in vivo infection environment. They analyzed whole-genome sequences from a lineage 4 outbreak and determined the base substitution rate; the in vivo data were in concordance with the in vitro per-day mutation rate.

Finally, the authors took these data and developed a simulation model of the evolution of drug resistance during infection in a human host. They simulate the emergence of multidrug resistance and show that in the model, individuals infected with lineage 2 strains had a substantially higher risk of acquiring multidrug resistance mutations.

Using a combination of in vitro, clinical and simulated data, Ford et al. contributed to our understanding of the emergence of multidrug resistance, highlighting the differences between strains and underscoring the importance of timely and sufficient treatment.

Woolly mammoth hemoglobin brought to life: From the archives (2010)

Combarelles-mammouth

{credit}Cave painting: Mammouth gravé de la grotte des Combarelles (Dordogne, France){/credit}

As part of the ongoing celebration of the last 25 years of Nature Genetics, the editors are each choosing a few papers from our archives that we want to highlight. My first pick a paper from Kevin Campbell, Alan Cooper and colleagues on their structure-function analysis of woolly mammoth hemoglobin, published in May 2010.

I’ve picked this one to highlight because, well, who doesn’t love woolly mammoths?

The authors compared the gene sequences of the adult-expressed α- and β-like globin genes from extant elephant species (African and Asian elephants) and from a 43,000 year-old Siberian mammoth specimen reported first in Science. They found that the mammoth β-like genes (designated HBB/HBD by the authors) had 3 amino acid-altering substitutions compared to the extant species.

To test the effects of these protein-coding differences, the authors then “resurrected” the mammoth hemoglobin protein by expressing the mammoth sequence in E. coli and testing its O2 affinity at different ambient temperatures. They found that the O2 affinity of the recreated mammoth hemoglobin is less affected by temperature than that of modern-day elephants. The detailed structure-function analysis reported by Campbell et al. offered us a rare glimpse into the evolutionary process that shaped an extinct organism.