More on the Shelf

In my last post, I wrote about shelf registration filings among small cap biotech companies. I defined a small cap biotech company as one engaged in drug development with a market capitalization of less than $1 billion. Often referred to by their SEC form designation, S-3, shelf registrations are prospectuses that allow companies to issue securities at any time within three years of the date of filing. Data from the past four years, specifically second quarter of 2010 to second quarter 2012, revealed that approximately 1/3 of US small cap biotechs use S-3 shelf registrations. Of those, however, around 80% of shelf-filing companies subsequently employ them, i.e., sell securities and raise additional capital, though the timing and the size of the first financing varies considerably. Thus, a company’s decision to put a shelf in place does indeed foreshadow a likely future financing, usually within six months.

I gathered a lot of extra data in conducting that analysis. Several readers put forth follow-up questions, which I address here. My database includes new shelf filings as recently as the end of Q2 2012, so many of the S-3s under consideration are still active. I should note that in the two months since I last wrote, numerous public companies have raised money by drawing upon securities registered in their S-3s. January 2013 was a particularly robust month for fundraising in the biotech sector. I’ve updated my data to account for the recent financings through January 2013.

@biotechbaumer asked, Would be interested to know how stock trades post S3 filing until the financing event(s) occurs.” 

Similarly, John Dyer of advisory firm Aquilo Partners asked, What’s the normalized stock price reaction (filing + one day, + 5 days) to a shelf filer? and “What is the normalized return of shelf users from filing?”

These are great questions, as they address both the market’s initial reaction to a shelf filing and the ability of an S-3 filing company to raise money at higher prices.

Looking first at short-term price movements, I examined the percentage change in share price one day after the S-3 was filed. For the 268 new S-3 filing made between Q2 2008 and Q2012, the average change was -1.5%, but there was wide range of -24.3% to +34.3%. The majority of 1 day price changes were negative; specifically, ~67% of S-3 filers experienced share price decreases the day following their shelf filing. The full distribution is shown in Figure 1.
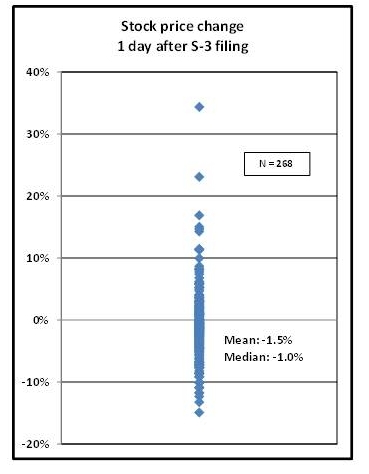
Figure 1

Of course, one day stock movements can be strongly influenced by overall market conditions on the same day. To account for this potential confound, I looked at the concordance between the one day stock movement for the S-3 filer and the one day movement of the NASDAQ Biotech Index (NBI). In the scatter plot blot below (Figure 2), when I plotted the percent change in S-3 filer stock price one day after filing versus percent change of the NBI that  same day. The data are pretty noisy, but I think it’s fair to say that the relationship between the two price movements is weak, which indicates that when the markets are up, the S-3 filer stock price is not necessarily up, as well. Further, if one creates a 2×2 matrix of price movements, it’s clear that even on days when the NBI is up, stock prices of S-3 filers are mostly down. Rarely is the converse true.
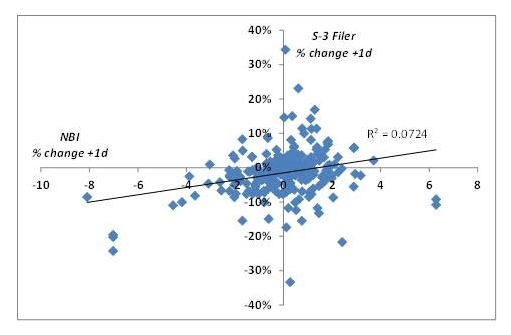
Figure 2

As I wrote previously, S-3s provide a mechanism to sell securities opportunistically. The hope, of course, is that if S-3 filers sell securities, they do so at a higher price to minimize shareholder dilution. How often do companies that finance off the shelf do so at a price above where before the shelf was filed?

Of the 268 S-3 filings, 215 companies subsequently raised money. Slightly less than have half, or 94/215 (~44%), raised subsequent money at share prices higher than the share price at the time of the S-3 filing.  The range in share prices at the first financing varied dramatically, however. As can be seen in the plot in Figure 3, the range was -91.4% to +1,467%, the average change was +13.6%, but the mean was much lower at -8.7%, indicating the effect of positive outliers. Indeed, price decreases are limited to 100%, but share increases are theoretically limitless.
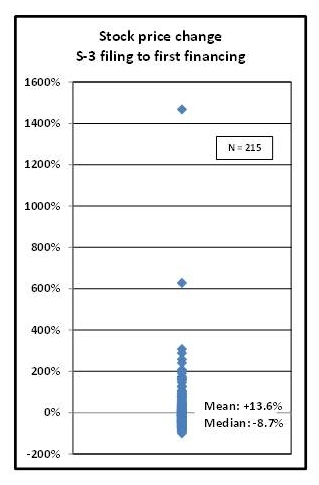
Figure 3


Lastly, @colinmagowan asked, “Did you track lead asset stage and disease, or say # of therapies in clinical trials when S-3 filed?”

I can see where the questioner is coming from; drug development costs vary by therapeutic areas. Thus, companies working in these areas may need to file larger shelves for more money. Further, the capital markets tend to value later stage assets more highly, as they are presumably closer to market. Late stage clinical trials cost more, too, so perhaps shelf filers and shelf size are related to stage of development.

I needed to go back and do some additional work for this question. To avoid the subjectivity of categorizing companies’ therapeutic area, I simply used the classification scheme put forth in each quarterly and yearly roundup issue of BioCentury. I realize that many readers do not have access to this industry publication, but suffice it to say that in these summary issues, the editors of BioCentury sort the majority of public biotech companies by therapeutic focus area. In Figure 4 are the data of S-3 filers, sorted by BioCentury classification, on shelf size and “implied dilution,” or the ratio of shelf size to market cap at filing. There may be hints of differences among companies focused on cardiovascular (CV) and pulmonary (Pulm.) regarding use of S-3s, but the sample sizes (Ns) are somewhat small in those categories. Otherwise, across therapeutic areas, it appears that implied dilution is in the 60-80% range on a shelf size of $50-$75 million dollars. (Recall that I define implied dilution as the ration of shelf size to market cap at the time of filing. The implied dilution is therefore a measure of the dilution that current shareholders would experience if all of the securities in the shelf were issued.)
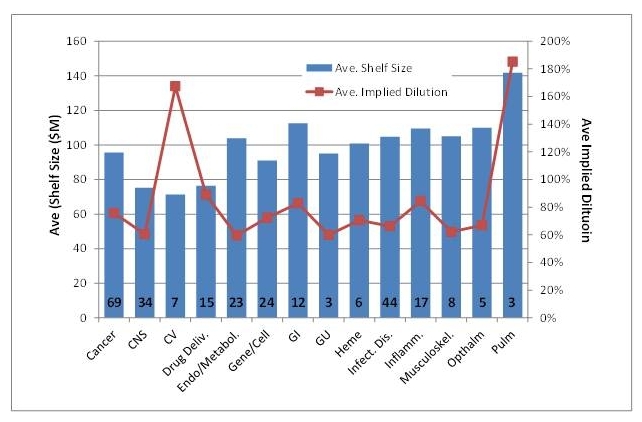
Figure 4

So, putting it all together, I’d say the takeaways are:

  1. The immediate market sentiment to the filing of an S-3 statement tends to be slightly negative, as suggested by 1 day stock movements in the context of broader market movements. That said, the price changes are usually less than 10%, which a long-term investor can generally accept.
  2. Whether the S-3 filing company subsequently raises capital at higher prices is not predictable; roughly half of them do, half of them don’t, with wide variations in between. Clearly, companies thrive or struggle based on their unique prospects. Another reason to do your due diligence.
  3. Therapeutic area doesn’t seem to impact S-3 shelf size. However, this conclusion is based on small Ns in some cases and the categorization of companies by therapeutic area is difficult, as lead programs may change, they might be based on platform technology that is broadly-applicable, etc.

Adam Bristol

The S-3 Barometer

Access to capital is essential for development-stage biotechs, yet the capital markets for public and private biotech companies are notoriously fragile. For private companies, venture investing in the life sciences has recovered from a rough patch in the ’08-’09 span to the robust financing environment in last year and a half. In the public markets, IPOs haven’t fully rebounded to historical levels, but follow-on financings and debt deals have been brisk as the biotech sector has performed extraordinarily well in 2012. Indeed, the NASDQ biotech index is up ~35% YTD at the end of the third quarter.

Public biotech companies have a mechanism, a shelf registration statement (or S-3, as it is known in SEC terminology), to register securities in advance of their issuance. The securities are “put on the shelf,” generally speaking, allowing them to be sold at any point within the 3-year lifespan of the shelf registration statement. One would think that having an active shelf registration on file is a must-half for public biotechs; they exist in a topsy-turvy macroeconomic environment compounded by the highs and lows of product development. Allowing them to raise money opportunistically and take advantage of strong capital markets or simply strong interest in their stock should be a good thing.

However, this is not the typical view. The filing of a shelf registration statement is often met with derision, and considered a bad omen that shareholder dilution is around the corner. If you follow any of the biotech stock watchers on Twitter, you know what I mean. My sense is that complaints arise primarily for three reasons:

  1. Investors seek to avoid dilution, and the issuance of new shares via draw downs from a shelf dilutes existing shareholders.
  2. Filing of an S-3 shelf registration signals to the market that a financing is forthcoming, thus creating an overhang on the stock, depressing its performance. In other words, why should big institutions buy shares in the open market if they can simply wait and buy in an upcoming follow-on financing?
  3. An active shelf is like a credit line for management that can be tapped at their discretion, so incentives are not fully aligned with shareholders if shelves are utilized haphazardly.

I don’t like dilution either, and I don’t like the artificial feel to the market cap increases that result from the issuance of more shares. But is there empirical support to the notion that S-3 filings predict subsequent financings? Is filing an S-3 a reflection of management and corporate strategy or a fact of life for R&D stage biotechs?

To address these questions, I looked at new shelf registration statements filed between Q2 2008 and Q2 2012 by US-based small cap biotech companies devoted to new drug discovery and drug development. I defined “small cap” as less than $1 billion, as this captures the vast majority of pre-commercial companies. I restricted the list to drug discovery and development companies because a) their value is largely “technology value” — the value ascribed to their development programs above the cash balance, and b) their cost of capital is heavily influenced by the perceived value of their technology.

During this period, I tallied 269 new shelf registration statements by 180 companies (some companies filed more than one, a replacement to an existing shelf that was either depleted or not). By my calculation, there are approximately 340 US-listed, small cap drug development companies in the sub-$1 billion range, so around 50% of these utilize shelf registration statements. Filing S-3s are not a universal capital-raising strategy.

But S-3 filers are a diverse group, with market caps at filing of between $11 million and $840 million. Further, the size of the shelf (that is, the total amount of capital that can be raised by the securities contained in the shelf) varied as well, though there was a slight trend for larger market cap companies to file larger S-3s. Of course, shareholders are interested in “implied dilution,” or the dilution that would occur if the entire shelf was drawn down. As expected, the implied dilution, or the ratio of the shelf size to market cap at filing, tends to be larger for small companies, but as shown in the figure (click to enlarge), there are some significant outliers. I assume that shelf size is related to the cost-intensiveness of future development plans, but perhaps I’m giving management too much credit. 

Is an S-3 filing a harbinger of a near-term financing? The data say: Yes. Of the 269 shelves, 207 (77%) have raised money. Of those 244 S-3s filed before January 1, 2012, that number rises to 82% (199 of 244). If one excludes those companies that were acquired with an active shelf in place (e.g., ISTA, ANDS, INHX, CLDA, ISPH, ADLR, MITI, PRX, PPCO), the number is closer to 85%.

The average time to the first financing was 207 days, with a median of 240 days. The magnitude of the first drawdown covered the full range, from 1% of the shelf to the full 100%. As shown in the figure, the majority of the first financings raised 50% or less of the full shelf value.


Taken together, the data around S-3s in recent years, a period of economic hardship, indicate that:

  1. Only about half of small cap therapeutics companies file shelf registrations
  2. For those that do, the overwhelming majority utilize them, usually in about 6 months
  3. The first drawn down is usually 50% of the shelf or less, which could give shareholders an estimate of the extent of dilution at a first raise.

Of course, as I noted above, raising money is a necessity for biotech, so noting here that they do, via the shelf mechanism, is somewhat self-evident; if a company files a shelf, why not use it? More important is when and how.  Ideally, shelves are utilized at opportunities when share price is high. Remember that S-3 remain active for three years, so market cap at the time of shelf drawn downs is perhaps a more important metric than market cap at the time of filing. If share price rises (and so market cap) during that time, the implied dilution would decrease.  These are questions to explore in future posts.

I should note that, in the process of compiling these data, I put together a fairly extensive spreadsheet with numerous metrics related to S-3 filers, such as stock performance, extent of insider holdings, estimated runway at the time of filing/draw-down, share price at first raise, etc. If any readers are interested in a particular question, please let me know in the comments below or via direct message on Twitter and I’ll see if I can address it with my database.

Adam Bristol

Death row for drug development costs estimates?

Last week, FDA Director of CDER, Janet Woodcock, lectured to a full house at the Mission Bay campus of the University of California – San Francisco.  She spoke on ways academic research centers could play a larger role in the development of new medical technologies.  I very much enjoyed the talk, the slides for which are available here.

One aspect of her talk struck me as surprising.  At the start of her presentation, as she set the stage with a description of rising healthcare costs and the significant challenges to developing new medical technologies, she cited the oft-repeated statistic that new drug development requires 10-12 years and costs over $1 billion dollars.  It was a casual remark, not controversial in the least, and since she was stating the obvious, the audience did not so much as blink as she proceeded to the main points of her talk.

I found this a little strange because Dr. Woodcock’s use of the statistic, as I interpreted it, was a tacit acceptance that the numbers are true.  Keep in mind that the FDA is often criticized as being largely responsible for the significant time and expense of new drug development.  Many industry analysts argue that it is due to FDA’s stringent regulatory hurdles that new drug development requires so much time and money.  To what extent this is true is subject to much debate, but I think it’s safe to say that, if I were at the FDA, I might not accept so willingly the magnitude estimates of a problem that I supposedly helped to create.

The numbers are indeed staggering: Ten to twelve years and over $1 billion dollars to develop a new little pill.  Comparisons to “Hollywood economics” and the film industry are often made, but I think oil field exploration is probably more accurate.

These figures were calculated by researchers at the Tufts Center for the Study of Drug Development (TCSDD), an academic think tank focused on the pharmaceutical industry.  The numbers are endorsed by PhRMA, the pharmaceutical industry organization, and they are often used as a justification for the high price tags on new therapies.  How else can a company recoup the significant time and investment in a new product but to charge upwards of $100,000 per year for its use?

These estimates have never sat well with me.  In my opinion, the 10-12 year, $1 billion dollar notion is misleading at best, and flat wrong at worst. Here are two reasons why.

First, these figures are based on historical data.  Specifically, they are based on the R&D expenditures on select new drugs originating in the major pharmaceutical companies, which most recent estimates use data to around 20051.  This is misleading because it measures how much it did cost, not how much it should or could cost.  So, while the bloated infrastructure and wasteful spending of Pharma companies during the boom years of the 1990s and 2000s is widely criticized, those expense measures are accepted as an accurate metric of “true” drug development costs?  Seems strange to me.  If a small town of 50,000 residents has a budget of $10 million, does that mean that it costs $10M to run a small town of 50,000 residents?  Not necessarily. Does it really cost $250 million to execute an inmate on death row in California? Yes, it can, but it doesn’t necessarily cost that much2.

Second, the estimates will go down in the future.  One obvious reason is that Pharma is slashing its R&D budget, so the denominator in the equation is shrinking. Acquisitions and in-licensing have costs too, but not as high as fully-integrated internal R&D and strategic transactions can be structured to mitigate risk (stage of development, option to license, CVRs, ability to terminate, etc.).  Furthermore, drug development strategies, especially clinical trial practices, are trending toward smaller trials in select patient populations with greater use of biomarkers.  These changes appear to reduce both sunk costs (money actually spent on discovery and development) and the cost of failure (which constitutes a substantial of the time and expense estimates), not to mention a positive impact on regulatory and payer reimbursement strategies.

Frankly, NO entrepreneurs or biotech executives today pitch to investors a 10-12 years, $1 billion drug development proposition.  They pitch focused development programs with expedited development timelines and reduced clinical costs.  Moreover, business development teams at the major pharmas similarly balk at licensing opportunities that require extra large and long Phase 3 development programs (think drugs for metabolic disease, with Phase 3 trials enrolling, say, 15,000 patients over 4-5 years and costing $300 million dollars).  I find it hard to see how the 10-12 years, $1 billion metric applies in drug development today.

Drug development is very expensive and lengthy, no doubt, and the TCSDD authors acknowledge the variability across companies and across therapeutic areas.   But my point is that the use of the 10-12 years, $1 billion notion is quickly becoming outdated, if it isn’t already, and is therefore misleading (not to mention self-serving).  So should we expect lower cost innovative drugs in the future?  Maybe, but I don’t expect the costs savings will be quickly or willingly passed on to consumers.  I absolutely believe that the FDA should not lower its safety and efficacy standards, though there is room for updating and validating new clinical endpoints for some diseases. Fortunately, structural changes in how pharma does business in addition to advances in translational medicine means they won’t have to.

Feel free to place your comments below.

Adam Bristol


References:

1)       Kaitlin, K.I. Deconstructing the Drug Development Process: The New Face of Innovation. Nature: Clinical pharmacology & Therapeutics, 87, 356-361.

2)       Tempest, Rone, “Death Row Often Means a Long Life”, Los Angeles Times, March 6, 2005

The Moneyball VCs

moneyball.jpg

What makes a great venture capitalist? Conventional wisdom says it’s the experience, expertise, Rolodex, and the visionary eye for spotting the Next Big Thing.

But what if this were wrong? What if the important variables in the statistical game of hitting one or two “grand slams” in a VC portfolio, which then make up for the dead or dying companies, could be identified and replicated? Why can’t there be a Moneyball moment for the VC industry?

Enter Correlation Ventures and Ulu Ventures, two new firms with heavy emphases on ‘quant’ approaches. Launched in stealth mode in 2010 with limited partners including University of Texas Investment Management Company and others, Correlation’s co-founders David Coats and Trevor Kienzle spent years building a proprietary database of company data and outcomes from which to mine for variables critical to success. This was not trivial; data on private companies is just that, private, and Messrs. Coats and Kienzle forged relationships with Dow Jones and multiple VC firms to access historical non-public data. For hundreds of historical deals, they catalogued over 50 variables, such as syndicate composition, management experience, and, most importantly, outcomes metrics for those investments. Correlation could then run multiple regression analyses and identify those variables that account for the most variance. Now in the business in making new investments, Correlation is able to conduct due diligence quickly – typically within two weeks – by entering relevant inputs into their model and adhering to a strict threshold on overall profile before doing deals. They expect to invest in 50 to 75 companies with the average investment size between $1 million and $4 million.

“There is a pervasive notion [in venture capital] that the best investors are intuitive pattern matchers with an uncanny ability to spot new market opportunities,” says Clint Korver, partner at Ulu Ventures in Palo Alto. Korver and co-founder Miriam Rivera believe that quantitative analysis can enhance experience by allowing intuition to be intelligently applied to investment decision making. Unlike Correlation, Ulu takes a Bayesian approach, explicitly incorporating expert judgment about the future into their models. Ulu first builds a map of the key drivers of risk and value for a startup, including factors such as life stage risks, total addressable market, margins, competition, exit multiples, and future capital needs. Ulu then combines intuition and data to assess possible ranges and probabilities for each of uncertainty. A cash flow model ties it all together, allowing Ulu to perform sensitivity analysis and focus due diligence on the risks that matter most. Korver says “while we look for companies with probability weighted multiple on investment of 10x or better, we do not blindly follow the numbers. We make decisions based on a compelling story.”

There are several intriguing elements in the new “quant VC” development. First, we would argue that an important aspect of what VCs mean by “experience” is indeed being an expert pattern matcher – quickly identifying pitfalls and seeing the ingredients for success. A strict quant approach like Correlation’s is essentially the same thing, but with the added benefit of removing cognitive biases and prejudices and, importantly, discovering relationships between variables and outcomes heretofore unrecognized.

Second, our hunch is that the general applicability of the approach varies depending on the sector. One obvious challenge is that quantitative approaches to investing, be them in public or private markets, are necessarily backward-looking in that they use historical data, and there can be no guarantees that the future will replicate the past. We see this challenge as most relevant to sectors undergoing significant dislocation, such as healthcare, in which legislative reform and widespread restructuring is redefining value drivers in the industry. Similarly, it is unclear how quantitative metrics can inform investment decisions in de novo fields such as renewable energy or nanotechnology with no historical precedent. Another point to consider is the extraordinary holding times now required for VC-backed healthcare investments – more than five years from seed investment to exit, according to recent data from Silicon Valley Bank.

But those data are restricted to companies that actually had an exit; many, many more are held much longer. Ten years seems like a lifetime in a high technology industry, and to compress that period into inputs and outputs seems ripe for misattribution.

By contrast, IT and software industries have a rich investment history dating back to the birth of the VC industry with multiple business cycles and thousands of data points. IT businesses, in particular, are largely driven by market forces as opposed to scientific hypotheses, which also make them easier to model. The time to market is also significantly shorter. Groupon, which recently completed a $700M IPO, was founded in 2008, just four years ago – that’s value creation at breakneck speed. Consider these advantages in light of recent data published by partners at Atlas Ventures and Highland Capital suggesting that IT investments exhibit significantly higher variability in their return multiples compared to life sciences investments.

With 100x outliers, such as Facebook and Zynga, the larger variance may lend itself to delineating key factors for success in IT investments. Not surprisingly, tech-orientated VCs including Google Ventures are beginning to embrace quantitative approaches to uncover lessons and refine their investing approach.

We’re attracted to the data-driven nature of the quant approach, and how Correlation makes and monitors investments is certainly more sophisticated that we can appreciate. But the jury is still out in whether venture-like returns will follow, especially in industries with high capital costs and long product development times, such as life sciences and healthcare. That said, with the venture capital industry contracting as a result of poor historical returns, quantitative venture capital offers an innovative approach for limited partners to mitigate risk and systematize early-stage investing with lean investment teams. Perhaps the rise of quantitative VCs also reflects the maturity of the industry, now with 30 years of ample historical data and the necessary informatics technology to digest it.

Innovative investing styles should be just as welcomed as innovative technology in the VC industry.

Adam Bristol and Justin Chakma

Fast start, not short course

Social networking website LinkedIn went public in May and the share price more than doubled on the first day of trading. By all accounts, it was a very successful IPO: LinkedIn raised over $350M in an offering that valued the company around $3B, and the existing and IPO investors could book a substantial, immediate return. In contrast to the hope of a mere resuscitation of IPOs in biotech sector, murmurs of another tech bubble ensued after the LinkedIn offering. Other tech IPOs in 2011, namely Zillow and Qihoo 360 Technology, also enjoyed extraordinary first trading days, appreciating 79% and 134%, respectively.

The extraordinary first day pop in LinkedIn’s share price elicited some criticism of the IPO underwriters. Did they deliberately under price the offering to reward preferred clients and, by doing so, essentially cheat LinkedIn out of millions of dollars? I doubt it, but based on historical data from RenaissanceCapital.com, a doubling of share price on the first day of trading is truly exceptional and harks back to the bubble years of 1999 and 2000. On average, IPOs appreciate around 10% on their first day of trading.

Fig 1(2)

Because IPO pricing is as much art as science, one might guess that IPOs for pre-revenue biotech companies, for which valuations are arguably more challenging than for revenue-generating IT companies, would be prone to such dramatic first day pops (or drops). Indeed, when I looked back at the 34 life sciences IPOs during the bubble years of 1998-2000, I found that the average first day pop was 45%, and that 8 of the 34 showed first day pops of 75% or more. The top of the pops during that period were:

Fig 2.jpg

Of course, one must not confuse a fast start with a short course. Remarkably, each of the life sciences companies with explosive historical IPOs listed above are still independent companies (note that Antigenics is now called Agenus) and all except Illumina are trading lower on a per share basis than the IPO offer price. I often remember this point when I read the impressive press releases announcing large, syndicated Series A rounds for private biotech companies.

Here again, the fast start does not mean a short course for private companies. Using the MedTRACK database, I ranked by size the 774 Series A financings in the US from July 2006 to July 2011 and looked at how the top 10% have fared. Not surprisingly, nearly two-thirds (46/74) of largest Series A round occurred before 2009, which shows how the economic downturn has impacted life sciences venture capital. More than two years have elapsed for those 46 companies and yet I counted only a handful of exits: 3 IPOs (Pacira, Sagent, and Zogenix) and two M&A exits (Calistoga and Rule-Based Medicines). Now, there have been other exits for companies of that vintage (e.g., Alnara, Trius, etc.) but their Series A rounds didn’t give them the “fast starts” I am referring to.

Do first day pops in the public markets or supersized Series A venture rounds tell us anything? Not much. They are little more than snapshots of investor expectations taken against a backdrop of macroeconomic conditions.

Considering the dramatic change in market sentiment over the last month, from a comparatively bullish first half of 2011 to a string of dramatic down days in August, it is clear that fortunes can change quickly. This is the challenge of the long course to building a successful business.

Adam Bristol

The Entrepreneur’s Bookshelf

books1.jpg

Joyce’s Ulysses. Huxley’s Brave New World. Faulkner’s The Sound and the Fury. Some of the most important books ever published in the English language. Or so I’ve heard. I’ve never read them. Of course, I want to read them. I suspect most of us have a reading list we apparently only manage to add to.

Well, here a few more candidates. I took note of the titles and authors of every book that came up during presentations or discussions over two years in the Kauffman Fellows Program, which I’m proud to say I recently completed. Somewhere between a mini-MBA course, a field guide to best practices in venture capital and entrepreneurism, and a self-help seminar, the KFP offers a group of change-the-world-type Fellows the opportunity to listen and learn from some of the best minds in business and innovation. Needless to say, I made sure to listen closely to what these people were telling me. What they were reading, or did read and deemed valuable, seemed important too. I think I caught every literary reference. To be clear, this isn’t a class reading list or required texts, but rather a compilation of off-the-cuff comments on impactful reading from a group of highly accomplished business people.

Here’s the list:

  • • Dialogue: The Art of Thinking Together – William Isaacs
  • • Thought as a System – David Bohm
  • • Primal Leadership: Realizing the Power of Emotional Intelligence – Daniel Goleman, Annie McKee, Richard Boyatzis
  • • Silent Messages: A Primer of Nonverbal Communication – Albert Mehrabian
  • • The 7 Habits of Highly Effective People – Stephen R. Covey
  • • The Speed of Trust – Stephen R. Covey
  • • The Rise of the Western World: A New Economic History – Douglass North and Robert Paul Thomas
  • • Crossing the Chasm – Geoffrey Moore
  • • The Post-American World – Fareed Zakaria
  • • Five Dysfunctions of a Team: A Leadership Fable – Patrick Fencioni
  • • Ethics for the Real World – Clint Korver
  • • Predictably Irrational – Dan Ariely
  • • Topgrading: How Leading Companies Win by Hiring, Coaching, and Keeping the Best People – Bradford Smart
  • • Joyless Economy -Tibor Scitovsky
  • • Mr. China: A Memoir – Tim Clissold
  • • Sharkproof: Get the Job You Want, Keep the Job You Love… in Today’s Frenzied Job Market – Harvey Mackay
  • • Gates of Fire: An Epic Novel of the Battle of Thermopylae – Steve Pressfield
  • • Where Good Ideas Come From – Steven Johnson:
  • • The Back of the Napkin: Solving Problems and Selling Ideas with Pictures – Dan Roam
  • • How We Decide – Jonah Lehrer

Looking over it now, I see an overarching theme of effective leadership, one of the most important elements in successful entrepreneurship and company building. Leadership is an expansive concept, so works on communication and team-building, ethics and integrity, and reflections on personal strengths and fallibilities all emerged from the group discussions.

I suspect that I’ll peruse most of these books at the library or bookstore, yet read only a few in their entirety. As I’m prone to do, which is somewhere in between I guess, is read a few thorough book reviews, and walk away feeling like I’ve read the books themselves. I can’t be the only one guilty of that infraction.

Of course, if you have a reaction to the list or suggestions for additions, please leave a comment below.

Adam Bristol

Pharma as Shareholder

A funny thing happened in the stock market last week. Signals for what eventually became an acquisition of a small cap biotech company Icagen (ICGN) were disclosed in an SEC filing because the acquirer, Pfizer (PFE), was a large shareholder. The events struck me as unusual because, a) it’s rare to see pharma publicly tipping their hand regarding business development activities, and b) it seems as though there are very few instances in which a pharma takes an equity position in a public company.

How rare is it? The chart below shows an analysis of public equities holdings of the top 15 pharma companies by revenues. I should note that the list excludes Roche’s large equity stake in Chugai, a Japanese pharmaceutical company, as well as Novartis’s large equity stake in Roche. That said, what I found is that the top 15 pharma hold equity in 40 public biotechs worldwide. To put that in context, in an industry with approximately 650 public biotechs globally, fewer than 10% have pharma as a shareholder.

Public_biotech_holdings

Notably, only TWO companies in my analysis had more than one pharma shareholder, those being Morphosys (MOR), a Germany-based antibody company (Novartis and Astrazeneca) and Intercell (ICLL), an Austria-based vaccine company (Novartis and GSK). The size of the pharma equity holdings ranged from the clearly de minimus ($1M or less) to the substantial; Sanofi’s stake in Regeneron (REGN) is now valued above $850 million and Eli Lilly’s holdings in United Therapeutics (UTHR) is worth about $340 million.

Perhaps we shouldn’t be surprised that GSK is an outlier among its peers. Known as a creative deal-maker, GSK holds equity in 15 public biotech companies, the largest position being in Theravance (THRX). It recently increased its stake late last year.

The majority of deals between biotech and pharma are licensing transactions, discovery alliances, or acquisitions that involve cash payments with no equity involved. Why does pharma take equity in public biotechs, and how might investors interpret this? When I categorized the 40 companies as either platform-based (discovery platform or specific domain expertise) or assets-based (no clear platform, pipeline of market products or diverse compounds), I found that the vast majority fell into the platform category, suggesting that pharma is taking equity in companies that have more to offer than a single lead drug candidate or a basket of assets. Icagen fit squarely in this camp, as the biotech was focused on a broad ion channel drug discovery platform. As for Morphosys and Intercell, the companies with multiple pharma shareholders? Both platform companies.

Platform_assets

Looking through pharma’s equity positions, I found many that were small (<5% positions), longstanding, and unchanged since the original position was established as part of a licensing or collaboration deal. These data raise many interesting questions (Does this subset of biotechs outperform? Are they more likely to be acquired by the shareholder? When does pharma buy and sell?). My sense is that having Pharma shareholders is certainly not a bad thing, but I wouldn’t say that it foreshadows a takeover anymore than a rich, late-stage licensing deal or a broad discovery alliance that does not involve equity.

Adam Bristol

Would Graham and Dodd have avoided small cap biotech?

security2.jpg

Benjamin Graham and David Dodd are synonymous with an investing strategy called “value investing.” As outlined in their classic 1934 book Security Analysis, value investing involves investing only in securities that the stock market has significantly undervalued. Warren Buffett is the most famous practitioner of this approach, and millions of other investors apply aspects of value investing to their own portfolios. Graham died in 1976, the year Genentech was founded. Would he have applied his methodology to the biotech industry? I doubt it.

In essence, value investing asks two fundamental questions: How much does it cost? And what is it worth? If something is worth more than it costs, it’s a good buy; this is the proverbial “buying a dollar for fifty cents.” As applied to investing, to know the current cost is easy: the market value of a company’s stock is simply the price at which the securities are trading. Estimating a company’s intrinsic value, or what it should be worth, is much more difficult. In most industries, investors analyze a wide variety of financial metrics to assess the value of a company’s assets and performance. Two simple examples would be ascribing a monetary value to an inventory’s worth of unsold merchandise or determining the yearly growth in product revenues.

The problem with biotechnology companies, especially small cap companies involved in drug development, is that the common financial metrics are imperfect or misleading, making a standard value approach nearly impossible. These companies usually have irregular or no revenues, can be unprofitable for many years, and may have few tangible assets. Rather, intrinsic value for many biotech companies must be derived largely from a mix of a body of qualitative metrics (such as strength of clinical data, management team, intellectual property and competitive positioning) with a few essential quantitative measures (such as cash balance and cash burn rate). Analysts flesh out financial valuation models using additional industry data and scenario testing, which definitely helps, but in my experience, the substantial qualitative component inherent in a company’s overall valuation can create real world price fluctuations that deviate substantially from the models.

Certainly, value investing as Graham, Dodd, and Buffett practice it involves qualitative judgments; the brand value of Coca-Cola was an important factor in Buffett’s investment. But Coca-Cola also has profit margins, earnings growth, and real bottling factories that you can touch, which can be ascribed present and future value. If Biotech X is on its seventh unprofitable year, with a year’s worth of cash, developing a small molecule oncology drug in Phase 2 after having achieved a partial response and five instances of stable disease in a Phase 1 trial – what’s that worth? This is not your father’s discounted cash flow (DCF) analysis of an appliance manufacturer.

Yet, the pricing inefficiencies that occur in biotech are exactly what a value investor needs to find great investments. If a market is perfectly efficient, all securities are accurately valued and there are no bargains for investors to seize. And one does see generalist value investors like Seth Klarman, occasionally take positions in small cap biotech companies, but these seems to be in opportunistic cases in which companies are trading below cash value. But a value investor’s mindset, if not the traditional tools, can be a successful approach to biotech investing.

Adam Bristol

Who Cares About the IPO Market?

IPOchange.jpg

No doubt you’ve heard that the IPO market for biotech companies has been especially weak the last two years. Few companies went public in 2008 and 2009, and those that did raised less money than expected, at lower prices, and with significant insider participation or other sweeteners. But the IPO environment seems to be thawing, with more companies expected to go public in the coming months, which leads to the question: Is this really such a good thing?

Holding aside the numerous macroeconomic reasons in support of a favorable IPO environment, IPOs in the biotech industry have particularly important place in the financing “cycle of life”. Drug development is long and very expensive, and IPOs (the theory goes) provide significant growth capital to maturing companies in an amount in excess of what venture capitalists (VCs) provide. IPOs also provide an exit point for early investors, granting them liquidity and a reward for the risk they took in funding a nascent private company. Fewer robust IPOs, however, mean VCs see fewer profitable exits, resulting in portfolio companies maintained in portfolios longer , which means less capital for new companies. This generally results in lower returns for VC funds and less money allocated to new VC funds during the next fundraising cycle. So, just like in the wild, take away an important prey (the IPO exit), and the predators (VCs) either starve or adapt to a new niche. This seems to have occurred the last few years, as many investors have favored late stage deals, and done more in medical devices and molecular diagnostics. So, for the biotech industry to thrive, we need a favorable IPO environment, right? Well, yes and no.

Certainly, removing a potential source of capital for companies is bad. But the problem is that the public markets are not well designed for pre-revenue, pure R&D companies, which describes the vast majority of biotech companies. What the public markets do well is value companies with revenues and earnings, because earnings and the present value of future earnings, along with other quantitative metrics, provide a sound basis for assessing company performance and forward prospects. Without earnings, R&D companies are VERY difficult for public markets to price, and all the value must be based on the hope of future earnings, which may never materialize. Thus, the soft bases on which public biotechs are valued results in tremendous pricing discrepancies between competitors with similar profiles and significant volatility in stock prices since perceived value fluctuates with news flow instead of quantitative data on corporate performance.

Maybe the difficult IPO market for biotech companies isn’t broken at all. Maybe it was broken in the past; it wasn’t long ago, 2004-2007, when 20+ biotech companies went public per year. Is that rational market behavior? The Silicon Valley timelines of tech companies, just a few years from inception to IPOs, are possible because those companies are capable of rapid go-to-market strategies to prove their technologies and generate real revenues. But this is incompatible with the long, expensive product development paths in drug development. Today, institutional investors are applying stringent criteria to IPO candidates, by and large backing only very late-stage companies with commercial launches on the horizon or products already on the market. This seems completely rational, and my hope is that it reflects a new chapter in the biotech industry.

Adam Bristol